Viewing Analytics Data
The analytics feature provides 3 basic types of data:
Page-Level Analytics Data
After you enable analytics tracking, your provider retains data on every visited page (that is, a unique URL) such as http://dev.ektron.com/articles.aspx or http://dev.ektron.com/template.aspx?id=6572. Data is tracked when the quicklink is used, as well as any alias assigned to the content. See Also: URL Aliasing
Viewing Page-Level Analytics from the Site
Any authorized user can view analytics for a page on your Web site by following these steps.
- Log in to the Web site.
- Navigate to the page whose analytics data you wish to view.
- Hover the cursor over the Web Site Content menu.
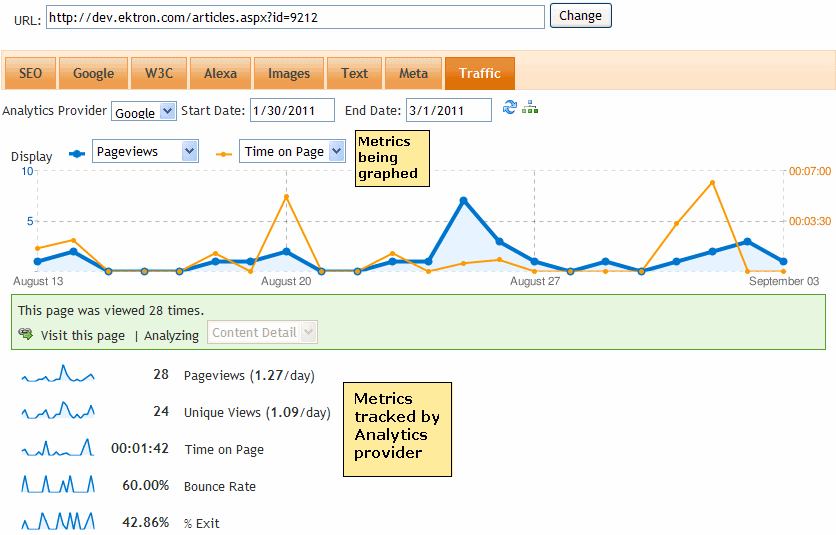
- Choose View Page Activity. The SEO page’s Traffic tab appears.

The Traffic tab of the SEO control graphs the analytics data of any 2 search criteria. Below the graph is data for the 5 visit criteria tracked by the analytics provider.
- Pageviews—number of pageviews for this page over the selected date range
- Unique pageviews—number of unique visitors to this page over the selected date range
- Average time on page—how long a visitor spent on the page. It is calculated by subtracting the initial view time for this page from the initial view time of the subsequent page. So, this metric does not apply to exit pages.
- Bounce rate—the percentage of single-page visits (that is, visits in which the visitor exited your site from the entrance page)
- % Exit—the percentage of site exits that occurred from this page
Note that you can change the date range, analytics provider, and either search criterion (Pageviews and Time on Page in the example above). To learn about using the Segments button (![]() ), see Viewing Google Segments.
), see Viewing Google Segments.
You can also replace the URL with a different one, and view the page being analyzed (by clicking Visit this page in the green bar).
Viewing Page-Level Analytics from a PageBuilder Page
Any authorized user can view analytics for a PageBuilder page by following these steps.
NOTE: You cannot drag and drop the Analytics widget onto a PageBuilder page.
- Open the PageBuilder menu. See Also: Creating Web Pages with PageBuilder
- From the menu, choose View > Analytics. The SEO page’s Traffic tab appears.
Viewing Page-Level Analytics from the Workarea
The Ektron Workarea provides 2 page-level views of analytics data.
- The View Content History screen—compares analytics data for any 2 published versions
- The Analytics toolbar button—displays the SEO page’s Traffic tab.
To view a content item’s analytics data from the Ektron Workarea:
- Navigate to the folder containing the content whose analytics data you want to view.
- Click the content item.
- To compare analytics data between any 2 published versions, click History(
 ).
).
See Also: Comparing Versions of ContentTo view analytics for the currently published version, click Analytics (
 ). When you do, you see the Traffic tab of the SEO page.
On the View Content History screen, blue and orange radio buttons appear next to each published version of content, as shown below.
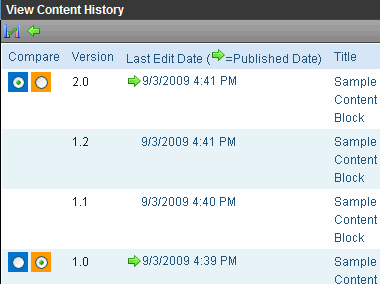
To compare analytics data, click the appropriately-colored radio button next to each version, then click Compare ( ). The Compare screen for the 2 versions appears.
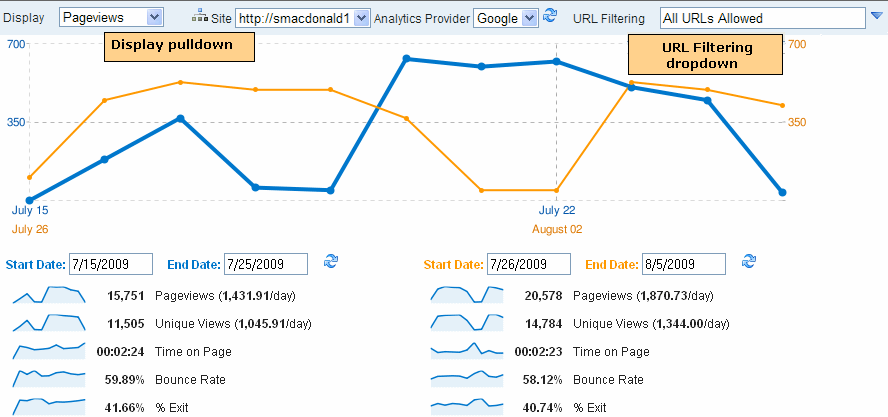
You can change the date range for each content version. You can also:
- Use the Display pull-down to graph any visit data.
- Click the URL Filtering tab to select the URLs being displayed. See Also: URL Filtering
- Select a different site
- Select a different analytics provider
-
Use the Segments button (
 ).
).
URL Filtering
Any content item can be viewed via several URLs, such as
- its quicklink. See Also: Adding a Quicklink or Form to Content
- manual alias
- automatic alias See Also: URL Aliasing
NOTE: While Regex-based aliases affect Analytics data, they do not appear on the URL Filtering tab.
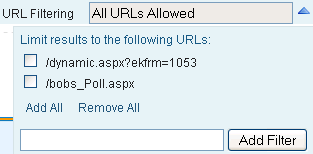
The URL Filtering tab of the Compare Analytics screen lets you analyze the data by each of these identifiers. So, for example, you can drill down to view only the data collected when site visitors accessed a page by typing its manual alias into the browser.
Site-Level Analytics Data
You can view analytics data for any site via the Analytics Report Widget and several reports. See Also: Widget Reference

You can drag and drop the Analytics Report Widget onto the Smart Desktop. When you do, you initially see the Direct Traffic report for the past 7 days. (See Also: Viewing Analytics Data)
You can click Edit ( ) to change the display using any of the options shown below.
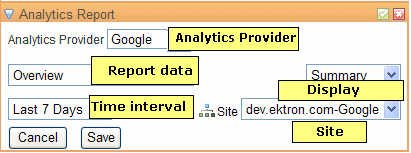
There are 3 time interval choices:
- last 7 days (the default)
- last 30 days
- last 90 days
Site Report Descriptions
You can customize the Analytics reports in the Ektron Workarea in the following ways.
- Change the text that describes a report or folder
- Remove reports or entire folders
To complete either task:
Prerequisite: Permission to edit files on your Ektron Web server
- Open the following file:
C:\inetpub\wwwroot\CMS400Developer\Workarea\controls\NavigationTrees
\WebtrendsReportSubtree.ascx - To change a report's or folder's text, find the text and replace it.
To delete a report or an entire folder, find it and comment it out.
See also:
