Google Web Analytics
Google Web Traffic Analytics is an enterprise-class solution that gives you rich insights into your Web site traffic and marketing effectiveness. Powerful, flexible and easy-to-use features let you see and analyze your traffic data in an entirely new way. With Google Web Analytics, you're more prepared to write better-targeted ads, strengthen your marketing initiatives, and create higher converting Web sites. Its main features are:
- Advertising ROI—Measure the success of your display, search, new media and offline advertising efforts.
- Cross Channel and Multimedia Tracking—Compare your site usage metrics with industry averages and track Flash, video, and social networking sites and applications.
- Visualizing Data—Uncover trends, patterns, and key comparisons with funnel visualization, motion charts, mapping, and more.
- Customized Reporting—Create the reports, dashboards, and segments that make the most sense for your business.
- Sharing and Communicating—Administration controls and email reports let you share data across your organization.
- Google Integration and Reliability—Google Web Analytics complements a suite of related products, all running on the same world-renowned infrastructure that powers Google.
For a product tour, see http://www.google.com/analytics/tour.html.
Tracking Your Entire Web Site
WARNING! Enabling the tracking code may cause a significant increase in CPU usage.
- Create a Gmail account (http://mail.google.com).
- Sign up for Google Web Analytics (www.google.com/analytics/). When you set up a Google Web Analytics profile for your site, you are assigned a profile ID and a User Account. You need those to complete Step 6.
- On the server that hosts Ektron, go to
C:\Program Files\Ektron\CMS400v8x\Utilities\EncryptEmailPassword.exe. - Use that utility to encrypt the Gmail username and password that you obtained in Step 1. Enter your full user name, including
@gmail.com. - Open your site’s
siteroot/web.configfile and find theAnalyticsDataProvidertag.<AnalyticsDataProvider defaultProvider="Google"> <providers> <add name="Google" type="Ektron.Cms.Analytics.Providers.GoogleAnalyticsProvider, Ektron.Cms.BusinessObjects" Username="" Password="" ProfileId="" SiteURL="" UserAccount="" GoogleAnalyticsTrackingCodePath="Analytics\template\googletrackingcode.ascx" /> </providers> </AnalyticsDataProvider>NOTE: If your
web.confighas several analytics providers and you want to turn off analytic tracking for one of them, delete the value of theGoogleAnalyticsTrackingCodePathproperty. - Complete the tag’s properties.
- name—The free text name of the site being tracked. You should use the site name followed by the provider name. For example, www.ektron.com-Google. Site-level displays of Web Analytics data within the Workarea let you choose a site from a drop-down. If you change the name, you must also change the value of the <AnalyticsDataProvider defaultProvider element to match the name.
- Username—The Gmail username you encrypted.
- Password—The Gmail password you encrypted.
- ProfileID—The Google Analytics Profile ID you obtained in Step 2. Another way to find your Profile ID is to go to Google Analytics and click Analytics Settings. Next Edit a Web site profile. The Profile ID shows under the Profile Settings Title.
NOTE: Tip! On the Google Analytics settings page, in the address bar, the
&id=value is yourProfileId.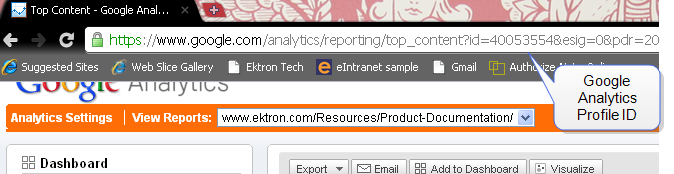
- SiteURL—Your site root name. For example, you could set up one
<providers>tag for thedev.ektron.comsite, and another for thesynergy.ektron.comsite. The SiteURL needs to match the development site URL when you test in your development environment. For example, if the site path ishttp://MyDevMachine/default.aspx, the SiteURL isMyDevMachine. If there is no match, the Google beacon is not inserted onto your page. - UserAccount—The Google Analytics SiteURL you obtained.
NOTE: Tip! When you visit your Google Analytics Settings page at google.com, the
UA-xxxxxx-xstring next to your site domain is the UserAccount assigned by Google.NOTE: To track multiple providers or sites, copy the contents of the
<providers>tag, paste it below the existing tag and above</AnalyticsDataProvider>, and modify the elements listed.
- name—The free text name of the site being tracked. You should use the site name followed by the provider name. For example, www.ektron.com-Google. Site-level displays of Web Analytics data within the Workarea let you choose a site from a drop-down. If you change the name, you must also change the value of the <AnalyticsDataProvider defaultProvider element to match the name.
- Within the
web.config's<analyticsSettings>tags is asuppressBeaconelement that lets you track or suppress the tracking of users on your Web site. Many site administrators do not want to track user behavior in Traffic Analytics reports, as it corrupts the data. (This setting does not apply to Business Analytics.) See Also: Analyzing Content. The following are the settings for this element.- None—Track all users, including authenticated membership and Ektron users.
- Members—Track unauthenticated and logged-in Ektron users only. Do not track membership users.
- Authors—Track unauthenticated and logged-in membership users only. Do not track Ektron users.
- All—Track unauthenticated users only. Do not track membership and Ektron users.
- Within the
web.config's<appSettings>tags is anek_AutoInsertBeaconScriptelement that either tracks or suppresses tracking activity on your Web site. Change itsvaluetotrue. - Save
web.config.IMPORTANT: No special server control is needed to track Web Analytics. After you enable Web Analytics in the
web.configfile, the following JavaScript is automatically added to each PageBuilder page and any site page that contains an Ektron server control.<%@ Control Language="C#" AutoEventWireup="true" CodeFile="googletrackingcode.ascx.cs" Inherits="Analytics_Template_GoogleTrackingCode" EnableTheming="false" EnableViewState="false" %> <!-- Start Google Code --> <script type="text/javascript"> var _gaq = _gaq || []; _gaq.push(['_setAccount','<asp:literal id="GoogleUserAccount" runat="server"/>']); _gaq.push(['_trackPageview']); <asp:literal runat="server" id="variables"/> (function() { var ga = document.createElement('script'); ga.type = 'text/javascript'; ga.async = true; ga.src = ('https:' == document.location.protocol ? 'https://ssl' : 'http://www') + '.google-analytics.com/ga.js'; s.parentNode.insertBefore(ga, s); var s = document.getElementsByTagName('script')[0]; })(); /* Start Track Event binding Code */ //// extracted from http://runtingsproper.blogspot.com/2009/12 /how-to-automatically-track-events-with.html //// un-comment the below if you would like google analytics to track your pdf download links on the website. //$(document).ready(function () { // TrackEventsForClicks(); //}); // //function TrackEventsForClicks() //{ // TrackEventByFileExtension(".pdf"); // // add your file extension here //} // //function TrackEventByFileExtension(FileExtension) // { // $("a[href$='" + FileExtension + "']").click(function() //{ // var fileURL = $(this).attr("href"); // _gaq.push(['_trackPageview', fileURL]); // }); //} /* End Track Event Binding Code */ </script> <!-- End Google Code -->
Tracking a Single Page
As an alternative to tracking your entire site, you can track individual .aspx pages. To do that, follow these steps on every page you wish to track.
Prerequisite: You completed all steps in Tracking Your Entire Web Site
- Open the
siteroot/web.configfile. - Find the
ek_AutoInsertBeaconScripttag. - Set its
valuetofalse. - Save
web.config.NOTE: The previous steps disable the tracking code on your Web site.
- Open Visual Studio.
- Open the .aspx page to which you want to apply the tracking code.
- In the Solution Explorer tree, navigate to
Workarea/Analytics/template/googletrackingcode.ascx. - Drag and drop that user control onto the page.
- Assign
EktronAnalyticsTrackingCodeas the ID of the control.
Tracking Clicks by File Type
To track the number of times that files on your site (for example, PDFs) are accessed, follow these steps.
Prerequisite: You completed all steps in Tracking Your Entire Web Site
- Open the
siteroot/web.configfile. - Find the
ek_AutoInsertBeaconScripttag. - Set its
valuetofalse. - Save
web.config.NOTE: The previous steps disable the tracking code on your Web site.
- Open Visual Studio.
- Open the .aspx page to which you want to apply the tracking code.
- In the Solution Explorer tree, navigate to
Workarea/Analytics/template/googletrackingcode.ascx. - Uncomment the code shown below.

/* Start Track Event binding Code */
//// extracted from http://runtingsproper.blogspot.com/2009/12/
how-to-automatically-track-events-with.html
//// un-comment the below if you would like google analytics to
track your pdf download links on the website.
//$(document).ready(function () {
//    TrackEventsForClicks();
//});
//
//function TrackEventsForClicks()
//{	// add your file extension here
//    TrackEventByFileExtension(".pdf");
//
//}
//
//function TrackEventByFileExtension(FileExtension)
//{
//    $("a[href$='" + FileExtension + "']").click(function() {
//        var fileURL = $(this).attr("href");
//        _gaq.push(['_trackPageview', fileURL]);
//    });
//}
/* End Track Event Binding Code */
The JavaScript tracks the opening of PDF files on your Web site. To add file types, copy TrackEventByFileExtension(".pdf");, paste it below, and update the file type. See example below.
xfunction TrackEventsForClicks()
        {
            TrackEventByFileExtension(".pdf");
            TrackEventByFileExtension(".png");
Google Site Reports
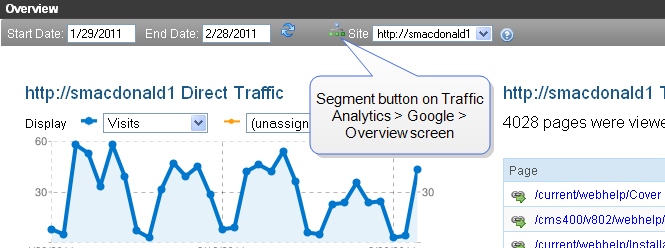
You can access site-level Google Analytics reports from within the Ektron Workarea by selecting Reports > Traffic Analytics > Google.
NOTE: The following text was adapted from Google Analytics Help Center (http://www.google.com/support/analytics/). Check that site for additional details on the reports.
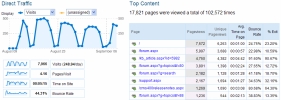
Google sites reports show direct traffic on left side, top content on the right.
Search reports show terms used by site visitors to find content on your site. Note that this data is not retrieved from Google Analytics. Instead, it is retrieved from Ektron’s site search.
The following sections describe Google's site-level reports.
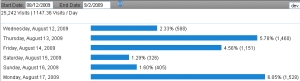
Visitors
This report shows the number of new and returning visitors who came to your site and how extensively they interacted with your content. This traffic overview lets you view aspects of visit quality (i.e. average pageviews, time on site, bounce rate) and visit characteristics (i.e. first time visitors, returning visits).
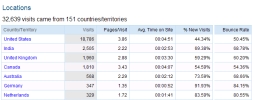
- Locations—Countries of your site visitors.
- New vs. Returning—The number of visitors to your site who are new or returning.
A high number of new visitors suggests that you are successful at driving traffic to your site, while a high number of return visitors suggests that the site content is engaging enough to keep visitors coming back. You can see how frequently visitors return and how many times they return in ‘Recency’ report and the ‘Loyalty report’, both under ‘New vs. Returning’ in the Visitors section.
- Languages—Uses the language provided by the HTTP Request for the browser to determine site visitors’ language. Values are given in 2- or 4-character language code (for example, en-br for British English).
This report captures the preferred language that visitors have configured on their computers. Understanding who your visitors are is crucial to developing the right content and optimizing your marketing spend. Many times, geo-location is not enough. Many countries have diverse populations speaking different languages which present important market targeting opportunities.
- User defined—If you modified the tracking code to provide a user-defined segment, this field identifies that segment by the string you provide when setting up a user-defined segment.
Visitor Trending
- Visits—The number of visits your site receives is the most basic measure of how effectively you promote your site. Starting and stopping ads, changing your keyword buys, viral marketing events, and search rank are some examples of factors that influence the number of visits your site receives.
- Absolute Unique Visitors—The number of unduplicated (counted only once) visitors to your Web site over the specified time period. A Unique Visitor is determined using cookies.
- Pageviews—The total number of pages viewed on your site. It is a general measure of how much your site is used. It is more useful as a basic indicator of the traffic load on your site and server than as a marketing measure.
- Average Pageviews—Average pageviews is one way of measuring visit quality. A high Average Pageviews number suggests that visitors interact extensively with your site. A high Average Pageviews results from one or both of:
- Appropriately targeted traffic (that is, visitors who are interested in what your site offers)
- High quality content presented effectively
Conversely, a low average pageviews indicates that the traffic coming to the site has not been appropriately targeted to what the site offers or that the site does not deliver what was promised to the visitor.
- Time on Site—One way of measuring visit quality. If visitors spend a long time visiting your site, they may be interacting with it extensively. However, Time on site can be misleading because visitors often leave browser windows open when they are not actually viewing or using your site.
- Bounce Rate—The percentage of single-page visits (that is, visits in which the person left your site from the entrance page).
Bounce rate is a measure of visit quality, and a high bounce rate generally indicates that site entrance (landing) pages aren't relevant to your visitors. You can minimize Bounce Rates by tailoring landing pages to each keyword and ad that you run. Landing pages should provide the information and services that were promised in the ad copy.
Browser Capabilities
Optimizing your site for the appropriate technical capabilities helps make your site more engaging and usable and can result in higher conversion rates and more sales.
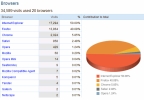
- Browsers—The browsers that your visitors use.
- Operating Systems—The operating systems that your visitors use.
- Browsers and OS—The browser/operating system combinations that your visitors use.
- Screen Colors—The number of screen colors your visitors use.
- Screen Resolutions—The screen resolutions that your visitors use.
- Flash Versions—The versions of Flash that your visitors have installed.
- JavaSupport—Whether Java is supported on your visitors' platforms.
Network Properties
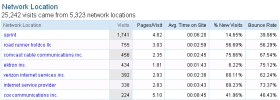
- Network Location—The internet service providers that your visitors use. This report lets you track the internet service provider (ISP) domains to which the user resolves.
The domain is determined by the internet service that owns the user's internet protocol (IP) identifier.
- Hostnames—Hosts from which people are visiting your site. Hostnames sometimes provide insight into organizations that are interested in what you offer.
- Connection Speeds—Connection speeds that your visitors are using. Optimizing your site so that it loads quickly for most visitors can result in higher conversion rates and more sales.
Traffic Sources
This section provides an overview of the different kinds of sources that send traffic to your site. The graph shows traffic trends; the pie-chart and tables show what is driving the trends.
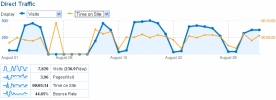
- Direct Traffic—Visits from people who clicked a bookmark to come to your site or who typed your site URL directly into their browser. Direct traffic can include visitors recruited via offline (i.e. print, television) campaigns.
- Referring Sites—Externals sites from which visitors linked to your site.
- SearchEngines—Visitors who clicked to your site from a search engine result page.
- All TrafficSources—Visitors referred from search engines, sites, and tagged links. The graph shows the overall trends while the table shows the specific sources (i.e. search engines, sites, and tagged links) driving the trends.
- Keywords—Compares traffic from search keywords to overall traffic to your site.
- Campaigns—How people referred from your configured campaigns compare to the “average” visitor to your site.
The graph shows overall trends, while the table lists each configured campaign. Because all traffic in this report results from campaigns that you explicitly control, you can use this information to add or delete campaigns, or to determine the effectiveness of tests that you have set up using custom tags.
- Ad Versions—Compares your AdWords ads (and configured campaigns in which you use the “content” tag) against each other.
This report shows you which ad copy (in AdWords ads or in configured campaigns) is most effective. Ads with high clickthrough rates show that the copy is effective at getting the user to click, while high bounce rates, for example, indicate a need for landing pages that are consistent with what the ad promises.
Content
This report provides an overview of pageview volume and lists the pages (Top Content) that were most responsible for driving pageviews. You can also reach some useful reports that reveal how users interact with your site and statistics related to how they found your site in the first place.
NOTE: Content reports include a link icon ( ) and a hyperlink. If you click the link icon, you go to the page. If you click the hyperlink, you see a more detailed Analytics report about that page.
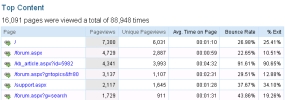
- Top Content—The most commonly viewed pages on your site, and how they are used.
The table lists all pages which were viewed on your site. A high bounce rate indicates a landing page that should be redesigned or tailored to the specific ad which links to it. A high 'Time on Page' may indicate content that is particularly interesting to visitors. The significance of exits varies according to each page. For example, it may be common for visitors to exit your site from a receipt or “thank you” page because they have completed a conversion activity. In contrast, a high number of exits from a non-goal page (from a funnel page, for example) may indicate that the page is confusing or that it generates user errors.
- Content by Title—The most commonly viewed groups of pages on your site (grouped by title), and how they are used. This report provides the same information in the “Top Content” report, but aggregated by title tag value.
- Top Landing Pages—Data on how effectively your landing pages entice visitors to click further into your site. You can lower bounce rates by tailoring landing pages to their associated ads and referral links and placing a clear call-to-action on each landing page.
- Top Exit Pages—Pages from which people exit your site.
The significance of an exit rate varies according to each page. For example, it may be common for visitors to exit your site from a receipt or “thank you” page because they have completed a conversion activity. In contrast, a large number of exits from a non-goal page (from a funnel page, for example) may indicate that the page is confusing or that it generates user errors
Viewing Google Segments
Google Analytics has an Advance Segments tool that lets you "slice and dice" your Analytics data with great precision. Advanced segments let you choose what types of visits you want to be considered when generating the data for a report." (source: http://www.google.com/support/analytics/bin/answer.py?hl=en&answer=108039)
Google segments allow marketers using analytics reports to drill down to specific classes, or segments, of site visitors, such as
- Users
- Sessions and visitors
- Members and authors
This section explains how to select and view segments within Ektron.
NOTE: While you can view custom segments within Ektron, you must create them within Google Analytics.
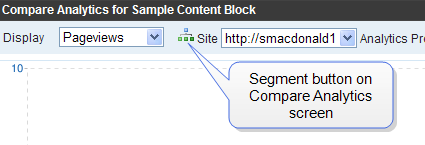
- Browse to a view of Analytics data. See Also: Viewing Analytics Data
- Click Segment (
 ).
).
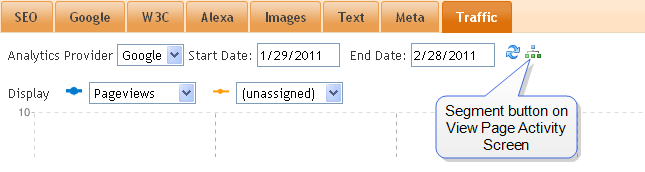
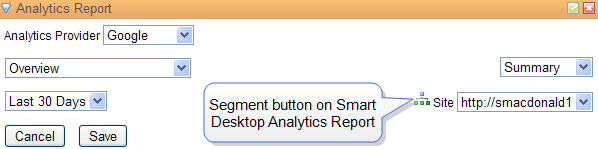
- The Segments screen appears. Select up to 4 segments to display.
- The screen refreshes and graphs each segment in a different color. In the following example, new visitors are graphed in blue and returning visitors are orange. Also, the screen breaks down data by each segment.
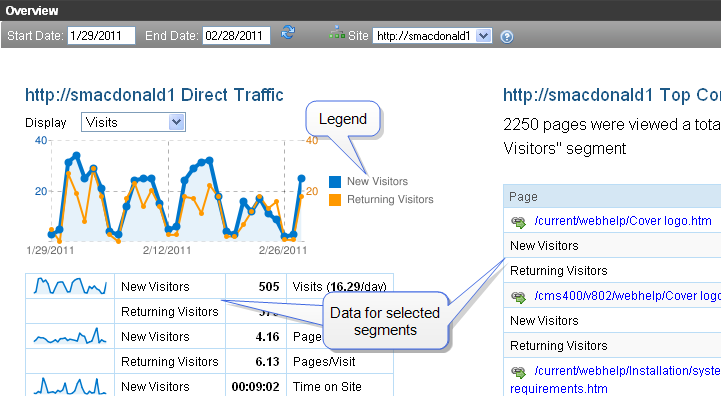
![]()