Business Analytics
The Business Analytics feature lets you track statistics about visits to your Web site. You can use it to determine the following kinds of information:
- how often your content was viewed
- how many site visitors viewed for first time, and how many returned
- the most popular referral pages (that is, the Web page from which visitors clicked to arrive on your site)
Several options for selecting a date range let you compare activity across different weeks, months, and years.
By default, the Business Analytics feature is disabled in the web.config file. To enable it, set the value of the ek_enableClassicAnalytics property to true. If you set this property to true and later change it to false, statistical data remains within Ektron, but no additional data is collected.
<add key="ek_enableClassicAnalytics" value="true" />
Business Analytics data are tracked for every template that has an Analytics Tracker server control. To track visitor activity to a template (for example, customerservice.aspx), drop the server control onto it. To track activity for a content items within that template, use control's properties designed for such tracking. See Also: Analytics Tracker Server Control.
|
Best Practice Drop the control onto an area that does not disrupt the template layout, such as the bottom. |
NOTE: The Business Analytics feature can only track template views if the viewer’s browser cookies are enabled.
Specifying the Frequency of Writing to the Database
After you set up the Business Analytics feature, your database is subject to a continuous barrage of write activity, generated by visits to your site. To optimize your database’s performance, you can hold visit activity in application server memory until a predetermined amount of data is collected. When collected, it is moved in one packet to the database. So, the database is “hit” much less frequently.
Specify the amount of data saved in memory prior to being written to the database using these web.config file elements.
recordsBeforeWrite—the number of unique template visitstimeBeforeWrite—the number of seconds since the last time a database write occurred
When either element reaches the value set in web.config, all records stored in memory are written to the database. That event resets both elements to zero (0).
Captured Statistics
For every template view, the following statistical information is captured.
- url—the visited page
- content_id—the ID of the visited content. Captured by the Analytics server control. Business Analytics
- visitor_id—a unique GUID that identifies a visitor
- hit_date—date and time when a page view occurred
- referring_url—the URL a user was viewing before jumping to the visited page
- visit_type—zero (0) indicates new visitor, 1 indicates returning visitor, 2 indicates all other views. After a user logs on, the first page hit tracks the visit as zero (0) (if the user is new) or 1 (if the user previously visited the page). From then on, 2 is logged for that user.
In addition to writing Business Analytics data to the database, you can write it to the IIS log. To do this, enable the appendToIISLog element in the web.config file. Note that if you set appendToIISLog to true, some Business Analytics data is only written to the IIS log and does not appear in the Workarea.
Tracking New and Returning Site Visitors
The Business Analytics feature provides information about visits made by new versus returning visitors. To capture this data, the feature asks this question whenever a page is visited: is the user logged in as either a membership or regular user?
- If yes, capture the user ID with the statistical data
- If no, place a cookie on the visitor’s computer
The next time the user visits that page, the feature checks the visit history for the user ID, or for a cookie. If either is found, the visit is considered a return.
The same user visit may be considered new on one view but not on another. For example, someone visits on January 30 (Monday) then again February 2 (Thursday). On the monthly statistics, that visitor is new, but on the weekly statistics, the February 2 hit would be a return visit (his second this week).
Now consider a second visitor, who browses to your site on the first and 20th of the month. These visits appear on weekly statistics as 2 new visits, but on the monthly statistics, only the first visit would show up on that month's tally of new visitors. The second visit would add to the return visitor statistics.
Reporting Business Analytics
The Business Analytics feature's reports let you drill down from the entire site to individual templates to individual content items.
Prerequisite: In your site's web.config file, the ek_enableClassicAnalytics setting is set to true.
NOTE: The Most Popular and Trends Widgets also report on Business Analytics data. See Most Popular Widget and Trends Widget .
To access Business Analytics Reports:
Either
- Browse to a content item for which Business Analytics data is being captured.
- Right click the mouse.
- Choose View Template Activity to see Business Analytics data for the current content item (to learn more about data captured for one content item, see Content View).
- ChooseView Site Analytics to view Business Analytics data for the entire site.
or
- From the Ektron Workarea, choose Reports > Business Analytics to view analytic data for the entire Web site. The following reports are available.
Analyzing Site Statistics
The following table shows analytic statistics available for each level of the site.
|
Type of Statistical Information |
Site-wide |
Template- |
Content- |
|
Views of Any Template |
|

|
|
|
Visitors: New and Return |
|
|
|
|
Pie Chart of New vs. Return Visitor |
|
|
|
|
Pie Chart of Views/Visitors Ratio |
|
|
|
|
Bar Graph of Views/Visitors Ratio |
|
|
|
|
|
|
||
|
Visited Content Blocks |
|
|
|
|
|
|
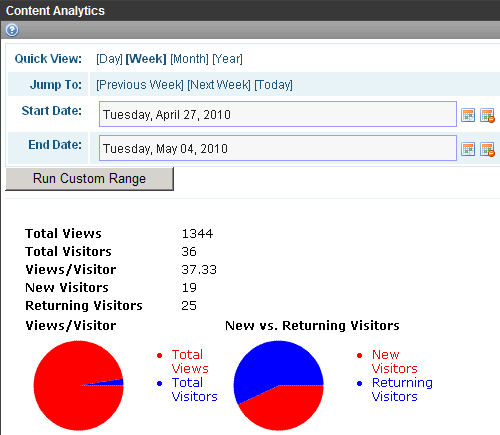
Site Statistics View
The Site Statistics view offers an overview of tracked activity within the selected date range. You see actual data for the
- number of views
- number of visitors
- ratio of visitors per view
- number of new and returning visitors
- ratio of new to return visitors
See Also: Tracking New and Returning Site Visitors.
Below this are pie charts of the ratio of views to visitors and new vs. return visitors.
Content View
The Content View shows the most frequently-accessed content on your Web site.
Click any content item to view:
- Content Statistics—statistics for that content item only (See Also: Analyzing Site Statistics)
- Content Activity—relative activity for that content item only (See Also: Content View)
- Audit Content—all users who viewed the selected content; to the right of each user are the date and time when content was viewed
NOTE: Only users who viewed content after logging in appear on the list. Site visitors who do not log in affect statistics but are not tracked on this report.
Templates
The Templates View shows all viewed templates on your Web site, with the most frequently-accessed ones on top.
By default, the templates at the top have the highest number of unique visitors. You can change the sort by clicking any column header. For example, to sort templates by the number of views, click Views.
You can click any template to view
- Template Statistics—statistics for that template only
- Template Activity—relative activity for that template only
- Content in Template—if a content item was specified for the template in the Content Analytic server control, this view show statistics for the template. You can click the template to view Template Level activity.
Changing the Date Range of the Statistical Data
When you first view statistical data, the default date range is today (one day).
If you view statistics for different date ranges, when you return to the screen, the last selected date range is the default selection. You can change it if needed.
Using Quick View Options
Use Quick View options to view analytics for any of these time periods.
- one day
- one week
- one month
- one year
When you click Quick View [week], [month] or [year], the current end date is used as the last day of the range. Here are some examples.
|
Quick view time option |
If end date is today, begin date is |
|
Week |
one week earlier than today |
|
Month |
one month earlier than today |
|
Year |
one year earlier than today |
Using Jump To Options
Use Jump To options to view statistics for a time period before and after the current date range. The time period is determined by the Quick View increment. For example, if the Quick View option is Day, you can jump to the previous day, the following day, or today.
Regardless of the Quick View increment, you can always view statistics for today.
Analytics Tracker Server Control
Use the Analytics Tracker server control to track Business Analytics statistics about visits to your site, such as:
- how often content is viewed
- how many site visitors viewed for first time, and how many returned
- the most popular referral pages
The data recorded by this server control is used by the Most Popular and Trends Widgets' Most Viewed category.
The data recorded is also used by the Classic Analytics Reports, available from the Ektron Workarea > Reports > CMS Site Analytics section.
IMPORTANT: Your site license key must support Analytics. You must also set the control's enableanalytics property to true or set the enableanalytics property to ConfigSpecified, and the enableAnalytics key in your web.config file to true
The AnalyticsTracker server control provides 3 properties for determining which content items are viewed when a site visitor browses to a page that contains the control. The properties are additive, that is they can be used together.
- DefaultContentID—tracks one content item
- ContentIdsList—tracks additional content items. For example, a page contains 4 content blocks, and you want to track a hit for each of them when a site visitor views the page. Insert one ID into the
ContentIDproperty, and the other 3 into this property. - DynamicParameter— tracks the content ID in the query string parameter of the URL used to access the page
If you want to track your entire site, place an Analytics Tracker server control on your master pages on your site templates, and use the DynamicParameter property.
The following are Ektron-specific server control properties. You can find information about native .NET properties such as font, height, width and border style in Visual Studio® help.
- Authenticated (Boolean)
Indicates if you are logged into the CMS Explorer and can use it to browse to content, collections, and so on. See Also: Browsing Your Ektron Site Using CMS Explorer.
- ContentIdsList (String)
Enter a comma-separated list of content IDs to be tracked. The DefaultContentId and the dynamicParameter are also tracked. See Also: Business Analytics
- DefaultContentID (Long)
The ID of a content block being tracked by this server control. It typically would be the content directly above the analytics tracker if no other content block is identified, or is not available. If you don’t know the ID number of the content block, use the CMS Explorer to browse to it. See Also: Browsing Your Ektron Site Using CMS Explorer
- DoInitFill (Boolean)
By default, Fill occurs during the Page_Init event. Set to false if you want to postpone the fill-action until later. In this case, Fill is automatically called during the Page Render event. You might do this if you need to set or change a property on the control in code-behind and have it render with your changes shown.
- DynamicParameter (String)
To make this control dynamic, select id. When you do, this server control is attached to the content block passed as a URL parameter.
- EnableAnalytics (String)
Set one of these values to determine if this server control tracks Business Analytics statistics.
- true—this control tracks analytics
- false— this control does not track analytics
- ConfigSpecified—use the setting in the
site root/web.configfile'senableAnalyticskey. For example, if that key =true, this control tracks analytics.
Note that the first 2 options (true and false) let you enable/disable this particular control. Use the last option, ConfigSpecified, if you want to use a single
web.configsetting to enable/disable all analytics controls. - Hide (Boolean)
Hides or displays the output of the control in design time and run time.
- True—Hide the control output.
- False—Display the control output.
- Language (Integer)
Set a language for viewing content; shows results in design-time (in Visual Studio) and at run-time (in a browser).
- WrapTag (String)
Lets a developer specify a server control’s tag.
- Span (default)—designate an inline portion of an HTML document as a span element.
- Div—apply attributes to a block of code.
- Custom—Lets you use a custom tag.
Most Popular Widget

The Most Popular widget reports on these categories of content on your Web site. By default, every Most Popular widget tab shows up to 5 results.
- Most Viewed
- Most Emailed
- Most Commented
- Highest Rated
You can place the Most Popular widget onto any PageBuilder page. See Also: Creating Web Pages with PageBuilder
NOTE: You cannot place more than one Most Popular widget on a PageBuilder page. Also, you can hide up to 3 tabs if you do not want all of them seen.
The Most Popular widget references content events, which areEktron events that are tracked when used with various server controls. Here are 2 examples of a content event:
- for the Most Viewed tab, the content was viewed and tracked by the Analytics Tracker server control
- for the Most Emailed tab, the content was emailed from the Social Bar server control
The Most Popular widget displays content items that meet these criteria.
- the content is tracked by a server control
- content events occurred within the date range set in the Most Popular widget properties. The default value is 7 days, but you can change it if desired. See Also: Reporting Business Analytics
- the content is assigned to a selected folder or taxonomy. By default, the widget has no folder or taxonomy restrictions. But the properties screen lets you restrict results by folder or taxonomy.
- the content is among the highest rated content items for that tab.
For example, if the Most Viewed tab shows the top 5 content items (the default setting), content that has not been viewed as frequently as the top 5 does not appear. Consider the following example.
Content ID
Number of Times Content
has been Viewed within Date Range30
87
259
82
316
78
12
78
658
67
243
62
In this case, content ID 243 does not appear on the Most Popular widget because it is sixth in the frequency of viewing rank.
Each time a content item is used with one of the following server controls, its count for that day is incremented by one.
|
Source of Content that Appears |
Tab |
Sample Event |
|---|---|---|
|
Most Viewed |
A site visitor browses to a page that is tracked by the Analytics Tracker server control. The control lets you determine which content is counted when the page is viewed. |
|
|
(it must be associated with content) |
Most Emailed |
A community group member browses to a page that hosts the Social Bar server control, and emails a content item to a friend. |
|
(it must be associated with content) |
Most Commented |
A Community Group member browses a page that hosts the Message Board server control and comments on a content item on that board. |
|
Highest Rated |
A site visitor browses to page that hosts the Content Review server control, and uses the control to rate a content item. |
Next to each content item is a count. The count indicates the number of times a content event occurred for that content item within the specified time frame. See Also: Reporting Business Analytics
Note that the date range may affect the count. For example, if a content item was viewed once a day for the past 10 days but the date range is set to 7 days, the count is 7. To change this maximum:
- Open
siteroot/widgets/mostpopular.ascx.cs. - Find the following line
private int _PageSize = 5;. - Change the number at the end of the line to the maximum number of results to display.
NOTE: This setting affects all tabs and instances of the Most Popular widget.
A logged in user can change the properties that determine what appears on the Most Viewed tab. To do so, click Edit (![]() ).
).
|
Property |
Default Value |
Description |
|
Tab text |
Most Viewed |
The text that appears on this tab. In the above example, the left tab 's text is Most Viewed. |
|
Visible |
checked |
Determines if the tab you are editing appears on the widget. At least one tab must appear. |
|
Number of days to report |
7 |
NOTE: You can change this to any number you wish. However, the widget can only show data for days for which data is stored in your database. |
|
Report |
|
Determines the information appears when a tab is clicked. |
|
Filter By |
Folder |
You can restrict the content appears on this widget by selecting a folder or a taxonomy.
While selecting a folder/taxonomy category, you have the option to include all folders/categories under the selected one. If you later want to remove this restriction, click Delete ( |
 ).
).Trends Widget

By default, the Trends widget shows the Most Viewed content on your Web site. You can edit the widget's properties so that it displays any of the following categories of content instead.
- Most Emailed
- Most Commented
- Highest Rated
The Trends widget is a subset of the Business Analytics, so you should be familiar with that section before reading this. It explains topics such as how Ektron determines which content appears for each category. You can place the Trends widget onto any PageBuilder page. See Also: Creating Web Pages with PageBuilder
A logged in user can change properties that determine the appearance of the Trends widget. To do so, click Edit (![]() ). The Trends Widget screen appears.
). The Trends Widget screen appears.
|
Property |
Default Value |
Description |
|
Report Type |
Most Viewed |
Report types are
|
|
Number of days to report |
7 |
NOTE: You can change to any number you wish. However, the widget only shows data for days for which data is stored in your database. |
|
Order Direction |
Sort Descending |
The direction in which search results are sorted. The default is Descending.
|
|
Maximum Number of Items |
5 |
Enter the maximum number of content items that may appear on the Trends widget. The Ektron database maintains a count (number of hits) for each content item, for each date. When you select a number of days, the Trends widget displays the content with the most hits during that date range, up to the number you set in this field. |
|
Filter By |
None |
You can filter which content appears on this widget by selecting a folder or a taxonomy. 
While selecting a folder/taxonomy category, you have the option to include all folders/categories under the selected one. If you later want to remove this restriction, click Delete ( |
Business Analytics API
The Business Analytics API's namespace is Ektron.Cms.Framework.Analytics.BusinessAnalytics and consists of several static methods arranged into 2 groups:
- those that save events to the database
- those that retrieve the event data from the database for use in reports
NOTE: The demonstration code in this section uses C# syntax.
Saving Event Data
To save events, use the static class EventLogger, which exposes the following methods.
IAnalyticsEventData CreateAnalyticsEventData()void Log(IAnalyticsEventData eventObject)void Log(string eventName)void Log(string eventName, string xml)void Log(string eventName, string xml, int count)
As long as an event (myEvent) has been registered in the system, you can store an event like this:
using Ektron.Cms.Framework.Analytics.BusinessAnalytics;
…
EventLogger.Log(“myEvent”);
This code saves the event data with default values. As shown, the Log method has several overloaded versions. Each provides a different amount of control over the information saved to the database. The following list shows the Log method's parameters.
- eventName (String)—A name that uniquely identifies the event. This name must be registered and enabled in the database for it to be recorded.
- XML (String)—This parameter is purely for customization. By default, its value is null. The API stack passes the string to the database, where the appropriate stored procedure can use it. For example, it can store additional values that are not part of the current event-object
- count (Integer)—Allows increments other than the default value of one. For example, you may want a specific event to increment the event counter by 5.
In addition to the parameters listed above, you can set other values by referencing the event object that carries the information to the database. A call to CreateAnalyticsEventData returns this object, and can be used as follows:
IAnalyticsEventData eventObject = CreateAnalyticsEventData();
Through the interface IAnalyticsEventData, the object provides the following additional parameters, which allow more control over what information is saved with the event.
- ObjectId (Long)—For a content related event, ObjectId should be set to a Content ID.
- LanguageId (Integer)—The content object's Language ID. If that is not available, the current request's Language ID.
- SiteId (Long)—The current request's Site ID
NOTE: A value of -1 means this value has not been set, and will be updated appropriately at a lower level.
- UserId (Long)—The current request's User ID (if logged in)
- VisitorId (String)—The current request's Visitor ID (if not logged in)
- EventDate (DateTime)—Defaults to current date and time
Retrieving Event Data
Use the static class EventReporter to retrieve events stored in the database. This class exposes the following methods.
IList<string> GetReportNameList()IAnalyticsQueryRequest CreateQueryRequest()IContentQueryRequest CreateContentQueryRequest()IList<IAnalyticsEventItem> GetList(IAnalyticsQueryRequest queryRequest)IList<IContentEventItem> GetList(IContentQueryRequest queryRequest)void UpdateReportData(String eventName, DateTime eventDate)
GetReportNameList Method
Use the GetReportNameList method to obtain a list of recognized (e.g., registered) report names. You can extend this list by adding custom event types and their corresponding stored procedure handlers.
For example, to obtain a list of the allowed report names, use the following code.
using Ektron.Cms.Framework.Analytics.BusinessAnalytics;
...
IList<String> names = EventReporter.GetReportNameList();
CreateQueryRequest Method
Use the CreateQueryRequest method to specify an event data report of the base-level type. The method returns an object that implements the interface IAnalyticsQueryRequest, which has the following parameters.
- ReportName (String)—Uniquely specifies the report, which is registered and corresponds to one or more stored procedures which, when run, generate the requested data.
- SiteId (Long)—The Site ID of the data being returned.
- UserId (Long)—The User ID of the data being returned.
- EventStartDate (DateTime)—If desired, use to determine the earliest date for which report data is returned. By default, data from the earliest date is returned.
- EventEndDate (DateTime)—If desired, use to determine the latest date for which report data is returned. By default, data through the most recent date is returned.
- PagingInfo (Ektron.Cms.PageingInfo)—Page size and number let you display a small portion of the report at a time. By setting page size and number, the report data is reduced, and performance will improve. Conversely, performance degrades as page size (RecordsPerPage) increases, especially if the amount of stored data is large. This type has the following fields:
- CurrentPage
- EndRow
- RecordsPerPage
- StartRow
- TotalPages
- TotalRecords
- OrderByDirection (EkEnumeration.OrderByDirection)—Descending or Ascending
- XML (String)—This parameter is purely for customization. By default, its value is null. While saving event data, the API stack passes the string to the database, where the appropriate stored procedure can use it. For example, it can store additional values that are not part of the current event-object. Within the
CreateQueryRequestmethod, this parameter can returns that string.
CreateContentQueryRequest Method
Use the CreateContentQueryRequest method to specify a report of event data that is related to content. It returns an object that implements the interface IContentQueryRequest which, in addition to those provided by interface IAnalyticsQueryRequest (see CreateQueryRequest Method) has the following parameters.
NOTE: You can use either the FolderID or the TaxonomyID parameter but not both. Also, you can only use the IncludeChild parameter related to the selected parent parameter.
- LanguageId (ID)—The Language ID of the content that the report returns.
- FolderId (Long)—The folder of the content being returned. All content in the folder is returned. It defaults to that of the current HTTP request.
- IncludeChildFolders (Boolean)—Determines whether the report includes children of the folder specified in the
FolderIDparameter. - TaxonomyId (Long)—The taxonomy category of the content being returned. All content to which the category is applied the folder is returned. It defaults to that of the current HTTP request.
- IncludeChildTaxonomy (Boolean)—Determines whether the report includes children of the folder specified in the
FolderIDparameter.
GetList Method
There are 2 versions of the GetList method.
One version takes an IAnalyticsQueryRequest object, and returns a list of objects that implement IAnalyticsEventItem. That version has the following parameters.
- ID (Long)—The object Id s supplied when the related events were saved.
- XML (String)—This parameter is purely for customization. By default, its value is null.
While saving event data, the API stack passes the string to the database, where the appropriate stored procedure can use it. It can store additional values that are not part of the current event-object.
The other version of the GetList method takes an IContentQueryRequest object and returns a list of objects that implement the interface IContentEventItem. That provides the following parameters in addition to those of IAnalyticsEventItem (shown above).
- LanguageId (Integer)—The Language ID of the content that the report returns.
- Quicklink (String)—The object's URL.
- Title (String)—Determines whether the report includes children of the folder specified in the
FolderIDparameter. - Teaser (String)—The content summary. See Also: Writing a Summary for Content
- Status (String)—The content's status. See Also: Content Statuses
- FolderID (Long)—The FolderID of the content being reported.
- Count (Integer)—The count of the object being reported. For example, if you are retrieving the most frequently emailed content item, the count is the number of times it was emailed. The count and average values may be used individually or together, depending on the report. For example, the rating report returns both the average (rating) and the count (the number of ratings), while the commented report uses only the count.
- Average (Decimal)—The a numerical value divided by the count. For example, when Ektron calculates average content rating, it divides the total number of rating points (on a scale of 1 thru 10) by the number of votes.
UpdateReportData Method
This method tells the database that an event's details should update that event's aggregated data. This method is only required if the database does not automatically do this, such as when the corresponding bit is disabled for that an type in the database. Disabling the corresponding bit generally improves performance, especially if the event logging rate is high. But, if you disable the corresponding bit, you must call this update method if you want the report to show current data.
The UpdateReportData method takes the following parameters.
- eventName (String)—The event whose data will be updated.
- eventDate (DateTime)—The date of the event's occurrence. For example, if you pass
1/1/2009, one row in the aggregate table is updated. If the row doesn't exist, it gets created. If you do not pass an event date, this method updates the aggregate table with summary info for that event for all dates. For example, if today is February 1, the system has been in use since the beginning of the year, and you pass NULL for the date, 32 table rows are updated (31 days in January plus 2/1).
Disabling the Saving or Reading of Events
You can disable the saving or reading of all events or of individual events.
It is useful to disable events when you want to minimize database traffic. To disable all events:
- Open
siteroot/web.config. - Set the following parameters to false.
<!-- Enable saving business-analytics events to the database (at API level) -->
<add key="ek_enableBusinessAnalyticsEventStorage" value="false"/>
<!-- Enable querying the database for business-analytics events (at API level) -->
<add key="ek_enableBusinessAnalyticsEventReports" value="false"/>
NOTE: These settings are set to enabled (true) by default.
You can also enable or disable individual events in the database itself, but this does require a call to travel through the full stack.
Using a Custom Provider
Below the service level are providers that read and write event data. The default providers simply pass calls through to the standard Ektron database-access-level code, which reads and writes from the database. But you can modify this behavior to almost any conceivable alternative. For example, you can
- save the data to an alternate database on an alternate machine
- call a Web service to handle the reads and writes
- filter the data and/or requests
- process information on its way to or from the database
The SDK contains sample providers, as well as full source code for the Ektron-supplied providers. You can use this material as a basis for writing custom providers, which is the preferred technique for customizing the behavior of the Business Analytics API stack and subsystem.
The Default Providers
The default providers for saving and reading event data (respectively) are EktronEventProvider.cs and EktronQueryProvider.cs. Example custom-provider source code has the following names for saving and reading event data (respectively): “DemoEventProvider.cs” and “DemoQueryProvider.cs” For the default providers, the siteroot/web.config file must contain the following, inside <configuration><configSections>.
<section name="businessAnalyticsQueryProvider"
  type="Ektron.Cms.Analytics.Providers.BusinessAnalyticsQueryProviderConfiguration,
  Ektron.Cms.BusinessObjects"
  allowDefinition="MachineToApplication"
  restartOnExternalChanges="true"/>
<section name="businessAnalyticsEventProvider"
  type="Ektron.Cms.Analytics.Providers.BusinessAnalyticsEventProviderConfiguration,
  Ektron.Cms.BusinessObjects"
  allowDefinition="MachineToApplication"
  restartOnExternalChanges="true"/>
Additionally, the following must exist inside the <configuration> tags.
<businessAnalyticsQueryProvider
  defaultProvider="EktronBusinessAnalyticsQueryProvider">
<providers>
<add name="EktronBusinessAnalyticsQueryProvider"
  type="Ektron.Cms.Analytics.Providers.EktronQueryProvider,
  Ektron.Cms.BusinessObjects"/>
</providers>
</businessAnalyticsQueryProvider>
<businessAnalyticsEventProvider
  defaultProvider="EktronBusinessAnalyticsEventProvider">
<providers>
<add name="EktronBusinessAnalyticsEventProvider"
  type="Ektron.Cms.Analytics.Providers.EktronEventProvider,
  Ektron.Cms.BusinessObjects"/>
</providers>
</businessAnalyticsEventProvider
Creating Custom Providers
To override the default Ektron provider with the a custom provider:
- Create a new solution with a project named CustomProviders.
- Add the following references to your project.
- Ektron.Cms.BusinessObjects.dll
- Ektron.Cms.Common.dll
- Ektron.Cms.ObjectFactory.dll
- Add files DemoEventProvider.cs and DemoQueryProvider.cs (from the Ektron SDK).
- Build.
- Copy the CustomProviders.dll file to your Ektron site's bin file.
- Update
web.configby modifying the<configuration>section. Specifically, add demo providers to the Business Analytics providers as shown below.
<businessAnalyticsQueryProvider
  defaultProvider="DemoQueryProvider">
<providers>
<add name="EktronBusinessAnalyticsQueryProvider"
  type="Ektron.Cms.Analytics.Providers.EktronQueryProvider,
  Ektron.Cms.BusinessObjects"/>
<add name="DemoQueryProvider"
  type="Ektron.Cms.Analytics.Providers.DemoQueryProvider,
  CustomProviders"/>
</providers>
</businessAnalyticsQueryProvider>
<businessAnalyticsEventProvider
  defaultProvider="DemoEventProvider">
<providers>
<add name="EktronBusinessAnalyticsEventProvider"
  type="Ektron.Cms.Analytics.Providers.EktronEventProvider,
  Ektron.Cms.BusinessObjects"/>
<add name="DemoEventProvider"
  type="Ektron.Cms.Analytics.Providers.DemoEventProvider,
  CustomProviders"/>
</providers>
</businessAnalyticsEventProvider>
![]()