 Insight Dashboard
The Insight Dashboard shows how topics Content Recommendations: An indexed subject, such as finance, insurance, hamburgers, rocks, or a brand name. are performing by number of interactions (views on a page), uniques Marketing Automation: the number of unique IP addresses that visited this page/URL during a specified period., and the number of interactions per unique visitor. This information can help you determine how users are interacting with content.
You can filter and save Interactions views for frequent use, and share a view with a linked URL. Saved filters are shown in the All Interactions menu.
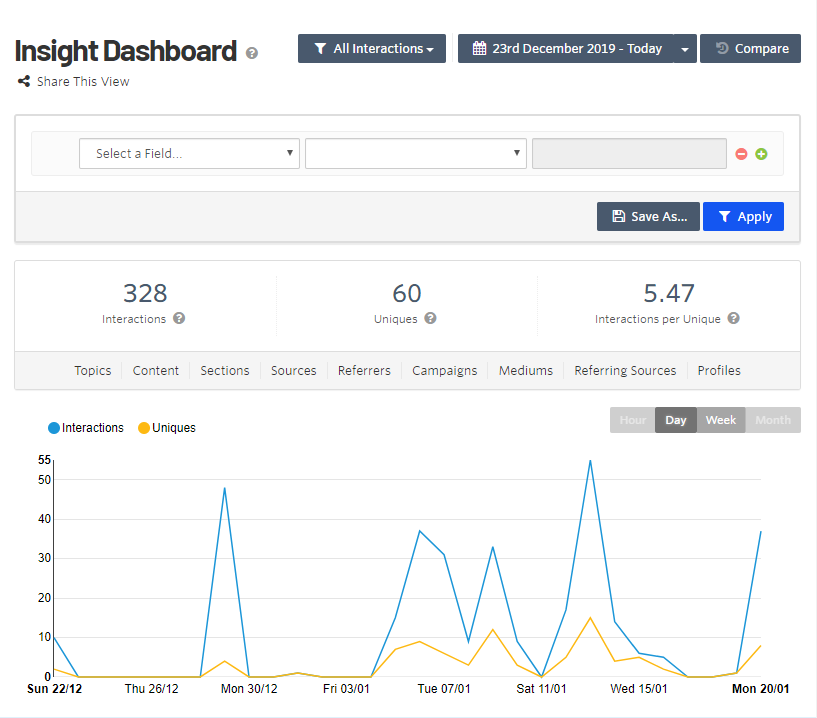
Date labels are in dd/mm format.
You can filter data. For example:
- Section: Blog
- Referrer: Facebook
- Goals: Signed up for Newsletter
- Result: Tells which topics and content drove users to the site from Facebook, read blog content, then signed up for the newsletter.

The following Insight Dashboard views show which items are performing best to least in the following categories.
- Views
- Topics in content
- Content
- Sections
- Sources
- Referrers. The URL Stands for "Uniform Resource Locator". Also known as a web address such as http://world.optimizely.com. from which a visitor came to your content.
- Referring Campaigns. The utm "Urchin Traffic Monitor" is a snippet of simple code that you can add to the end of a URL to track the performance of campaigns and content. code (for Google Analytics only) where a visitor came from.
- Referring Mediums. The marketing channel Channel through which advertising messages or information are transmitted to customers and prospects. For example, email, SMS, print or push. from where a visitor came.
- Referring Sources. Links to your content.
- Profiles
- Performance categories
- Interactions
- Percentage of Interactions
- Uniques Marketing Automation: the number of unique IP addresses that visited this page/URL during a specified period.
- Percentage of Uniques
- Interactions Per Uniques (IPU)
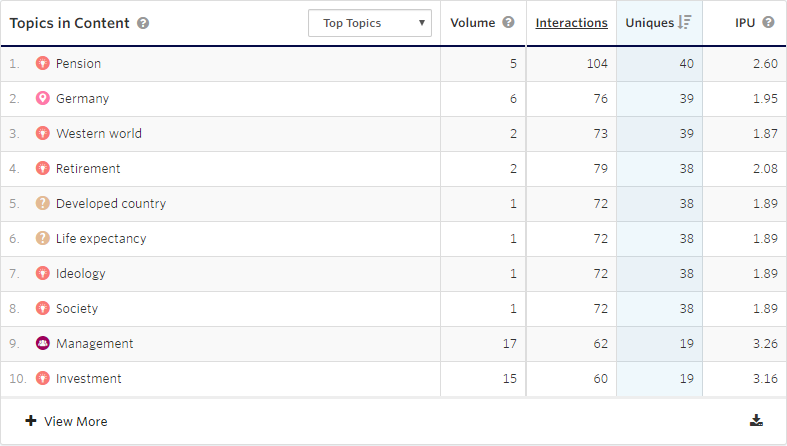
Topics in Content view
The Topics in Content view shows the number of interactions (from highest to lowest) that each topic had with content that contains it. Topic ranking helps you determine whether content is performing as you expect it to.
To download the table data for up to 250 topics, click the Download icon in the lower right corner.
The drop down menu lets you show Top Topics, any filter selections that you have saved, and any filter selections that others have shared with you.
Content View
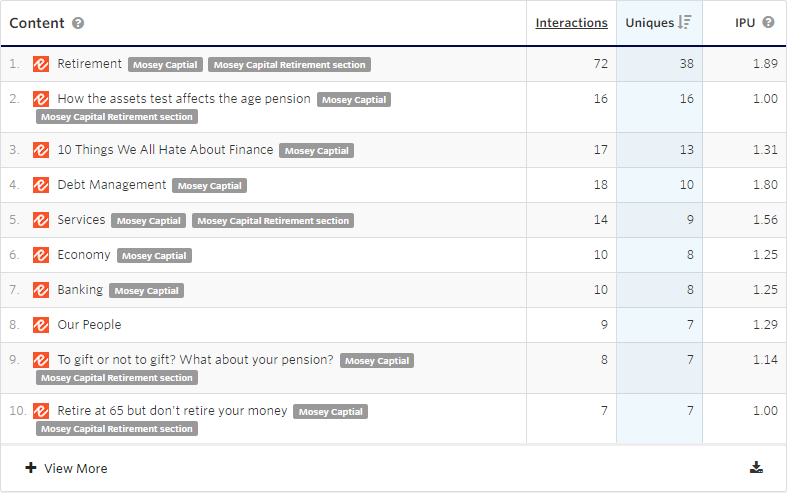
The Content view shows the number of interactions (from highest to lowest) that each content item had.
Sections view
The Sections view shows the number of interactions (from highest to lowest) that each section Content recommendations: Groups of content based on flow rules. For example, a Europe section may include blog posts about London, Amsterdam, or Paris; while an Asia section may include blog posts about Shanghai, Hong Kong, or Tokyo.'s content had.
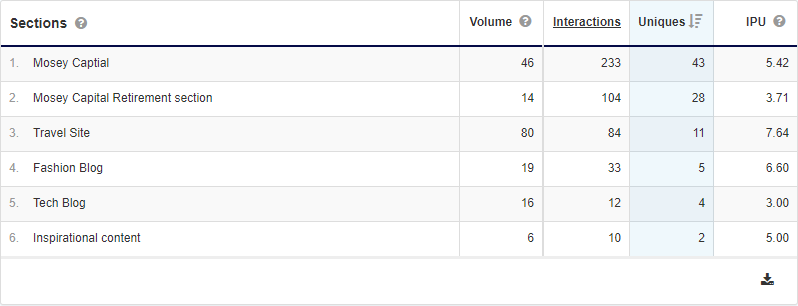
Sources view
The Sources view shows the number of interactions (from highest to lowest) that each source's content had.
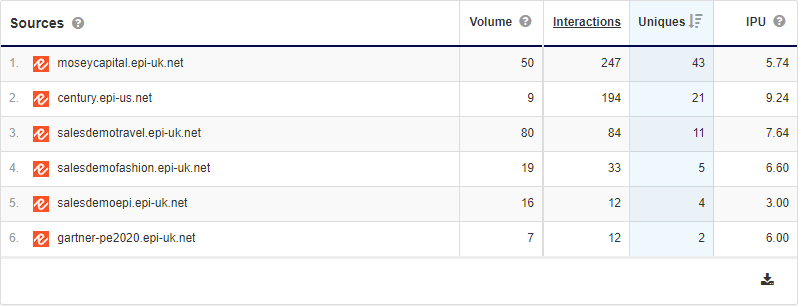
Referrer views
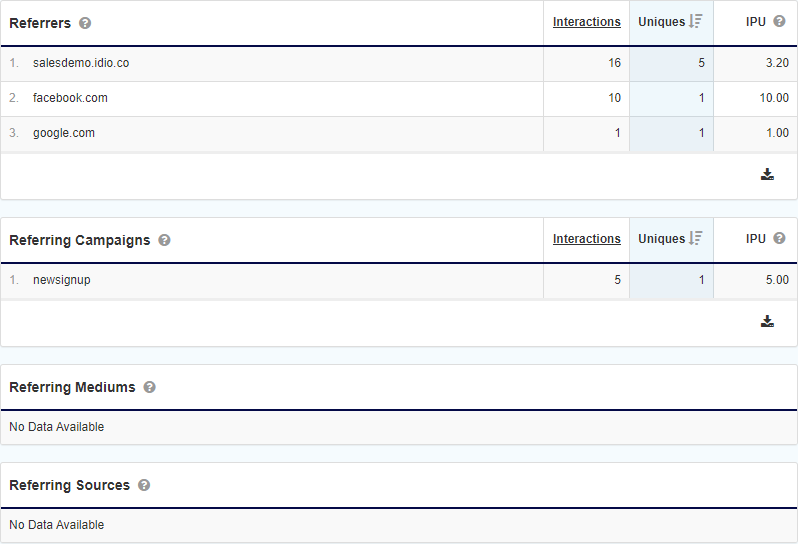
The Referrer views are as follows.
- Referrers. Sites that link to your content. You can filter these to determine the content that engages visitors from each referrer.
- Referring Campaigns. Marketing campaigns in which you track clicks by adding value to your marketing links, such as Google's utm_campaign. You can filter these to determine the performance of content by campaign.
- Referring Mediums. Marketing channels, such as Social and PPC, where you add values to marketing links such as Google's utm_medium. You can filter these to determine performance of content by channel.
- Referring Sources. Tracks clicks from places where your content is linked, such as Facebook or Newsletter. You add values to marketing links such as Google's utm_source. You can filter these to determine performance of content by linked source.
Profiles
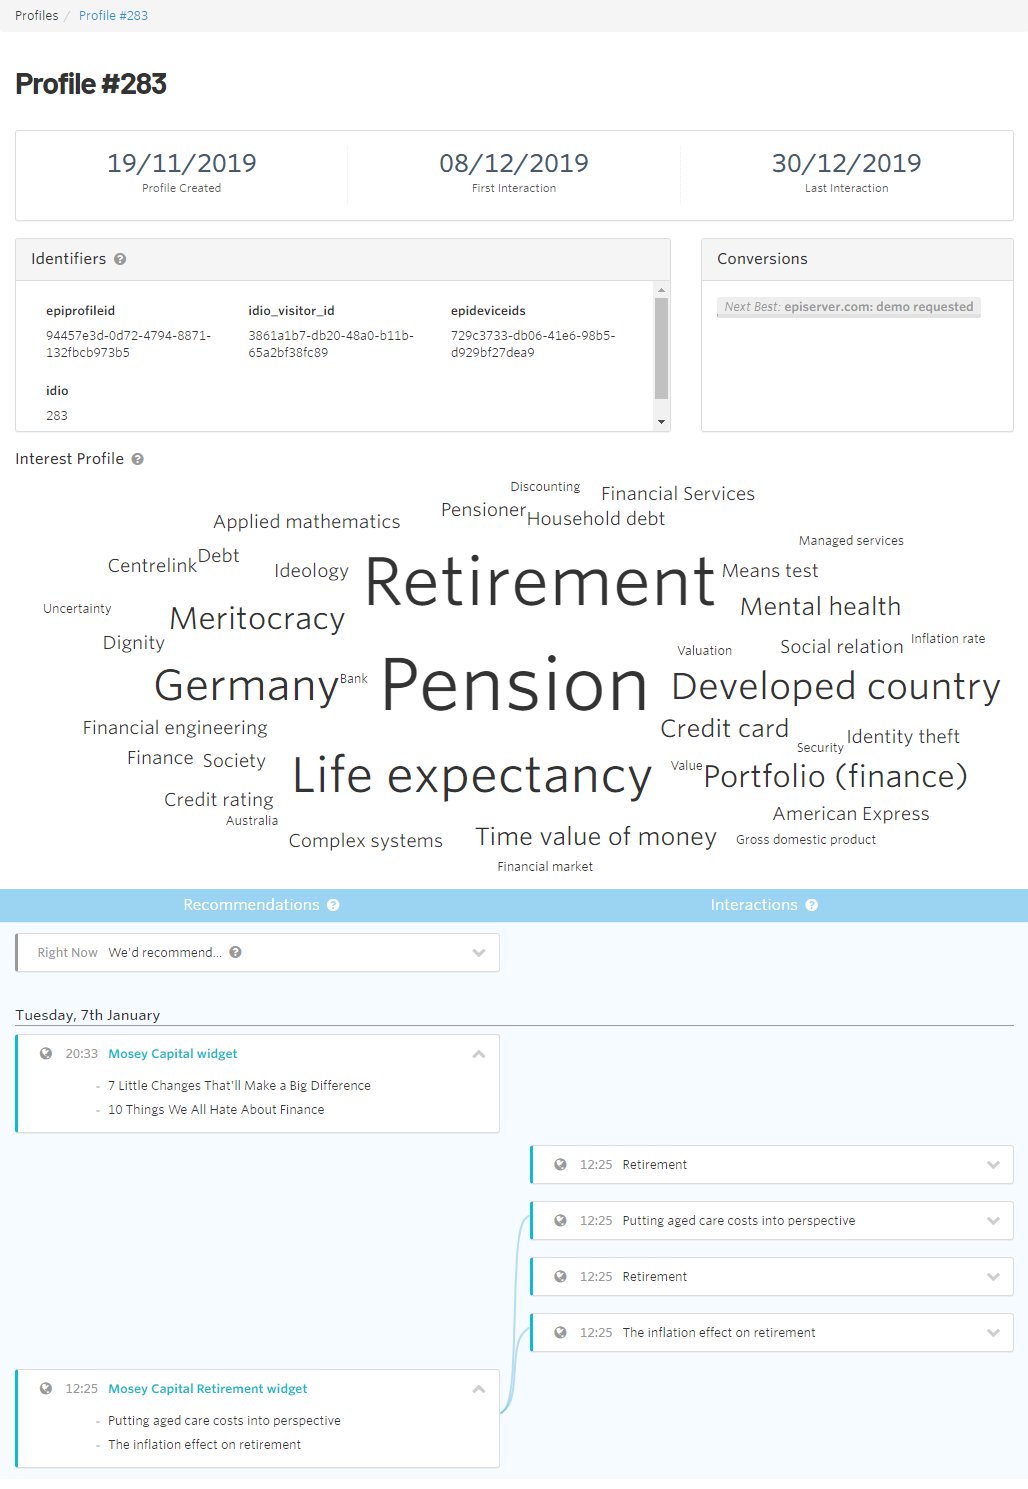
The Profiles view shows individuals that interacted with your content, ordered from most to least interaction.
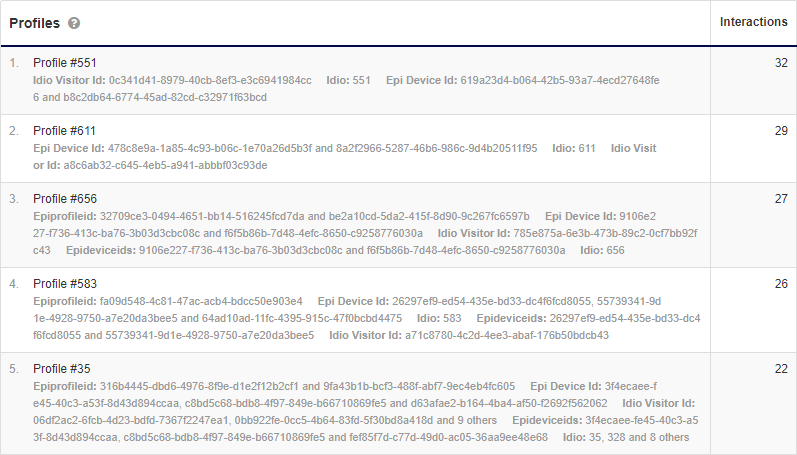
To examine a profile, click a profile ID. You can also go to Insight > Profiles and enter a profile ID (or any other identifier such as idio-visitor-cookie) and click Go. Then click the profile ID.

The Profiles view lets you examine details about a visitor profile. Data includes:
- Profile Created. Date.
- First Interaction. Date.
- Last Interaction. Date.
- Identifiers. Content Recommendations ID, email, marketing automation ID, and so on.
- Conversion. Shows which conversions were made based on the goals.
- Interest Profile of topics. Heat map of topic interests.
- Recommendations. Sent to the visitor (either via widget or email).
- Interactions. Made by the visitor.
Date labels are in a dd/mm format.
