Setting up Webtrends Analytics
Marketers today face a new set of challenges. With the explosion of new digital channels such as social and mobile, it is even harder to understand customer behaviors and optimize how to communicate with them. Both Webtrends Analytics On Demand and On Premises deliver the industry’s most accurate picture of how customers interact with your brand in the digital space.
Real-time data, intelligent alerts, and the ability to easily share information within your organization means you empower your team to make smart and timely decisions based on solid data. You'll find new opportunities, ensure conversions are on track and respond to needs faster than ever before.
Prerequisite: Webtrends On Demand
- Create a Webtrends Account and create a tracking script.
- Set up an account with Webtrends (https://developer.webtrends.com/login.jspa).
- Webtrends sends you an account name, username, and password.
- Log into Webtrends using this URL: https://developer.webtrends.com/index.jspa?showpreview=true.
- Use the account name, username, and password you obtained from Webtrends.
- From that page, follow this menu path: Administration> Application Settings > Data Sources.
- Click New. A Data
Source Wizard screen appears.- Enter a name for the data you will retrieve.
- Select your server's time zone.
- Click Next.
- A summary of the information you entered appears along with a Webtrends data collection server ID (DCSID) value.
- Click Save. The Data Sources screen reappears with your new data source.
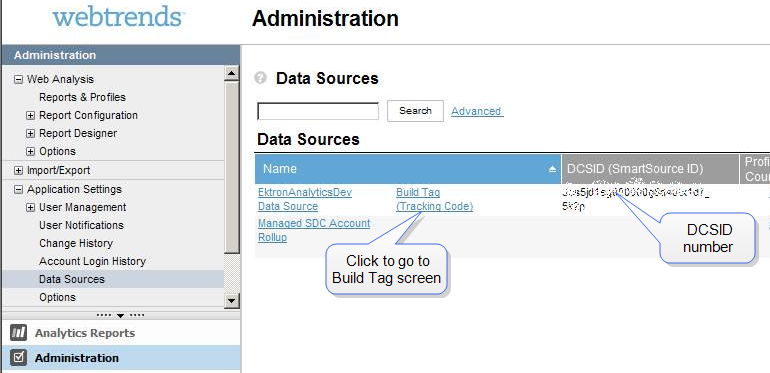
- Copy your Data Source ID number (DCSID), indicated in the following figure. You will use this number in the next step.


- Build the Tracking Files. In this step, you tell Webtrends the type of data you want to track. Webtrends then generates files that track that data.
- Open Webtrends' Tag Builder page: https://tagbuilder.Webtrends.com/?WT.mc_id=Dev_network_link.
- From the Data Sources screen, you can click Build Tag (Tracking Code).
- Complete this page, which prompts you to identify which data Webtrends should track.
- Into the page's Webtrends data collection server ID (DCSID)field, paste the number you copied in Step 1g above. For help completing the Tag Builder page, click the information button in the top right corner.
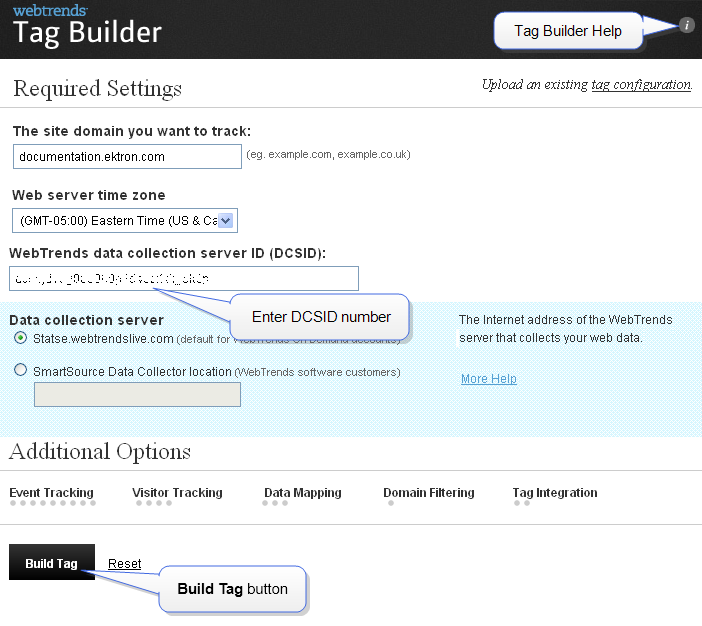
- Click the Build Tag button. Webtrends generates files you will use to track usage statistics. The Summary and Confirmation screen appears.
- Click the Download tag button.
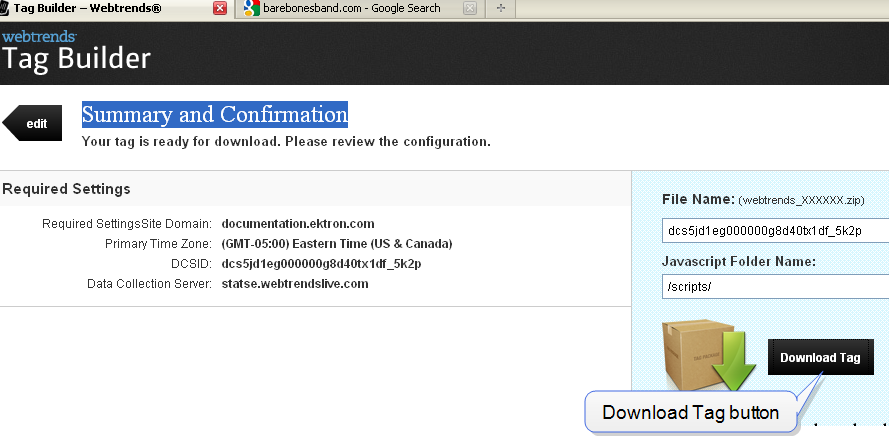
- Save the .zip file to your computer.
- Copy Webtrends Tracking Files to Ektron. You must have permission to edit files on theEktron Web server. In this step, you will...
- replace the
Webtrends.htmlfile in your Workarea folder with the one you downloaded. - replace the
<div>tag in your Workarea's Webtrends.ascx file with the one in the downloaded file of the same name
- Extract the .zip file you downloaded.
- Open the folder that contains the extracted files.
- Copy
Webtrends.js. - Paste it into the
site root\Workarea\Analytics\templatefolder. This action replaces a file of the same name. - In the folder that contains the extracted files, open
Webtrends.html. - Copy the
<div>tag highlighted below. 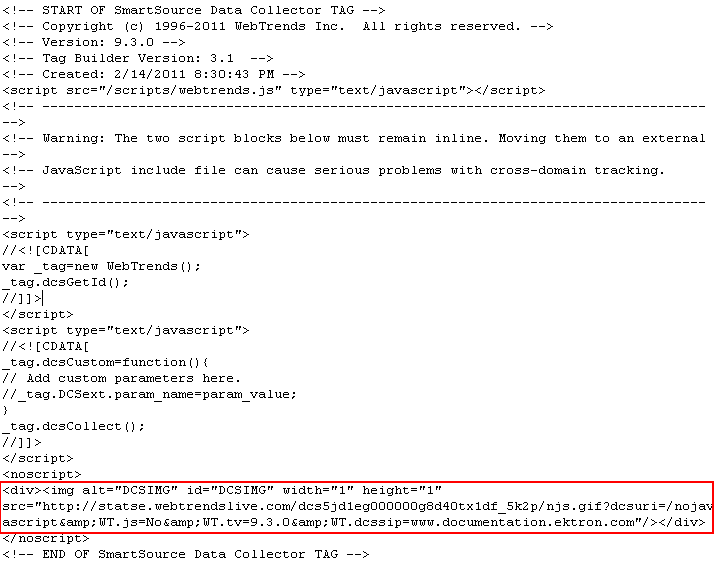
- In the
site root\Workarea\Analytics\templatefolder, open Webtrends.ascx. - Replace the
<div>tag with the one you copied.
- replace the
- Update Ektron's
web.configfile. You must have permission to edit files on your Ektron Web server.- Obtain a value for your
web.configfile'sProfileFileNameproperty by going to https://ws.Webtrends.com/v2/ReportService/profiles/?format=xml.- In the User name field, enter your account name\username that you obtained.
- In the Password field, enter your password. A screen displays your Webtrends profile as follows.
<?xml version="1.0" encoding="utf-8" ?>
       —<list>
       —<ProfileDefinition>
       <string name="ID">ABCD1234</string>
        <string name="name">MyAnalyticsAccountName</string>
        <decimal name="AccountID">234567</decimal>
        <decimal name="TimeZoneID">-500</decimal>
        </ProfileDefinition>
        </list>
You will use the
string namevalue (highlighted in red),ProfileFileNameproperty.
- Open your
siteroot/web.configfile - Find the tag beginning with
<add name="Webtrends". - Replace the
Webtrendstag's properties.- Name—The name displayed on the report. If you have several accounts, you can use names like these.
- Webtrends—dev.ektron.com
- Webtrends—document.ektron.com
However, the value of this field for one analytics provider must match the value of the
<AnalyticsDataProvider defaultProvider>tag. - Type—Do not change.
- Username, Password—
- Go to
C:\Program Files\Ektron\CMS400v8x\.
Utilities\EncryptEmailPassword.exe - Encrypt the Webtrends username and password you obtained.
- Enter the encrypted values into these properties.
- Go to
- ProfileFileName—Enter the string name value you obtained.
- SiteURL—Enter the URL visitors use to access your site. For example, www.example.com.
- UserAccount—Enter the account name you obtained.
- Endpoint—The default value is
https://ws.Webtrends.com/v2/ReportService/. You only need to update this value if you are not using the default Data Collection Server on the Tag Builder page. - Cache Interval—You may use this field to cache the Analytics provider's data. Enter a number in seconds. The maximum 86400. Caching improves the performance of the traffic report page.
- AnalyticsTrackingCodePath—Do not change.
- Name—The name displayed on the report. If you have several accounts, you can use names like these.
- Obtain a value for your
Displaying Webtrends Site Reports
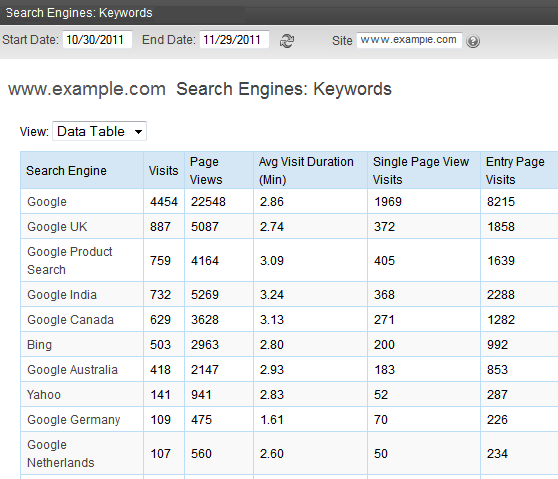
You can access Webtrends analytics reports within the Workarea by selecting Reports > Traffic Analytics > Webtrends.
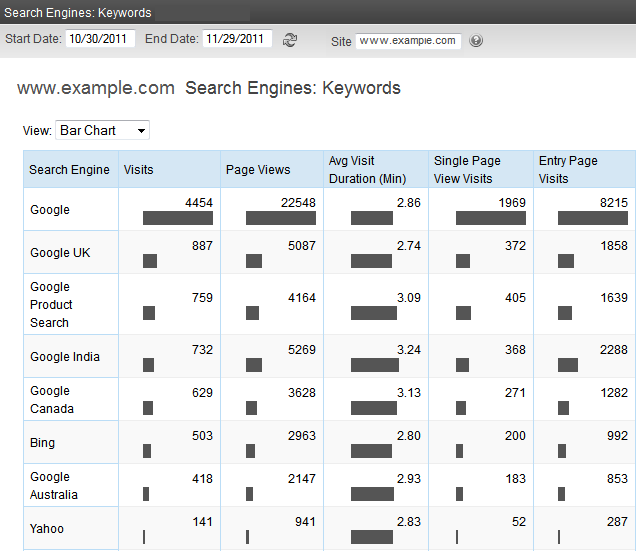
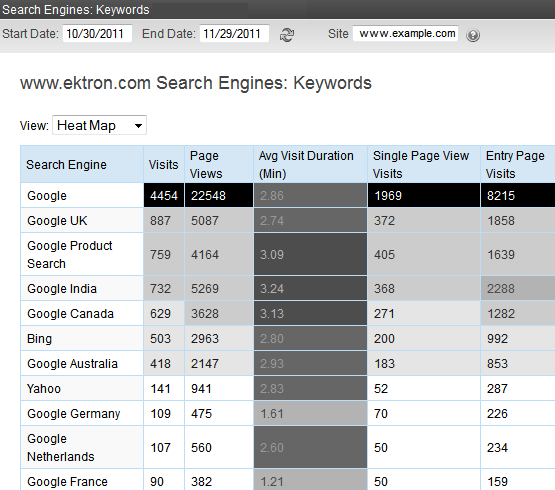
Display Options
Webtrends reports provide the following display options.
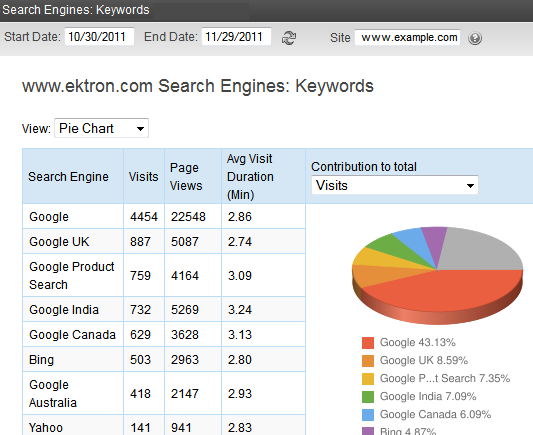
From the pie chart, you can change the display to see percentages of the following factors.
- Visits
- Page views
- Average visit duration (minutes)
- Single page view visits
- Entry page visits
Report Descriptions
The following text was adapted from Webtrends Analytics Help Center (https://insight.Webtrends.com/Help/en/). Check that site for additional details on the reports.
- Overview Dashboard—An overview of the data in the report template. You can click a graph title to navigate to the corresponding report.
- Key Metrics Summary—Key measures of your site's growth and performance over time. The trend intervals displayed depend on the selected report period.
Marketing Reports
Campaigns
Purchase Conversion Funnel by Campaigns
Shows how successfully individual campaigns led visitors to purchase engagement and conversion by showing the number of visits referred by each campaign for each step of the purchase process.
Shows the visitors' most recent campaigns during the report time period. For that period, all conversions and other activities are tracked and attributed to the last campaign to which visitors responded. Thus, even if the conversion does not happen on the first visit generated by the most recent campaign, the appropriate source is "credited" with the conversion. Drill-down levels may be the result of a custom dimension definition or from an applied campaign translation file.
Shows activity occurring during the report time period segmented according to the demand channel of the most recent campaigns. For the report time period, all conversions and other activities are tracked and attributed to the last campaign to which visitors responded. Thus, even if the conversion does not happen on the first visit generated by the most recent campaign, the appropriate source is credited with the conversion.
Shows the partner of the most recent campaigns that drove traffic to your site during the report time period. For the report time period, all conversions and other activities are tracked and attributed to the last campaign to which visitors responded. Thus, even if the conversion does not happen on the first visit generated by the most recent campaign, the appropriate source is credited with the conversion.
Shows the marketing programs for the most recent campaigns that drove traffic to your site during the report time period. For the report time period, all conversions and other activities are tracked and attributed to the last campaign to which visitors responded. Thus, even if the conversion does not happen on the first visit generated by the most recent campaign, the appropriate source is credited with the conversion.
Shows the marketing activities for the most recent campaigns that drove traffic to your site during the report time period. For the report time period, all conversions and other activities are tracked and attributed to the last campaign to which visitors responded. Thus, even if the conversion does not happen on the first visit generated by the most recent campaign, the appropriate source is credited with the conversion.
Shows activity occurring during the report time period segmented according to the creative type of the most recent campaigns. For the report time period, all conversions and other activities are tracked and attributed to the last campaign to which visitors responded. Thus, even if the conversion does not happen on the first visit generated by the most recent campaign, the appropriate source is credited with the conversion.
Shows activity occurring during the report time period segmented according to the creatives of the most recent campaigns. For the report time period, all conversions and other activities are tracked and attributed to the last campaign to which visitors responded. Thus, even if the conversion does not happen on the first visit generated by the most recent campaign, the appropriate source is credited with the conversion.
Shows the offers for the most recent campaigns that drove traffic to your site during the report time period. For the report time period, all conversions and other activities are tracked and attributed to the last campaign to which visitors responded. Thus, even if the conversion does not happen on the first visit generated by the most recent campaign, the appropriate source is credited with the conversion
Shows the offers for the most recent campaigns that drove traffic to your site during the report time period. For the report time period, all conversions and other activities are tracked and attributed to the last campaign to which visitors responded. Thus, even if the conversion does not happen on the first visit generated by the most recent campaign, the appropriate source is credited with the conversion.
Shows activity occurring during the report time period segmented according to the campaign ID of the most recent campaigns. For the report time period, all conversions and other activities are tracked and attributed to the last campaign to which visitors responded. Thus, even if the conversion does not happen on the first visit generated by the most recent campaign, the appropriate source is credited with the conversion.
Shows activity from campaign IDs that drove traffic to your site during this time period. Only Campaign IDs seen during the period of the report are tracked.
Shows activity from campaigns that drove traffic to your site during this time period. Only names of campaigns seen during the period of the report are tracked.
Segments
Campaigns by New vs. Returning Visitors
Shows how effective your most recent campaigns are at generating new vs. returning visitors. With drill-down the user can examine this information at a highly summarized level and navigate to successively more detailed levels of campaign data; for example, viewing new vs. returning visitors by Demand Channel, Partner, Marketing Program, Marketing Activity, Campaign ID, and Campaign Description
Campaigns by New vs. Repeated Buyers
Shows how effective your most recent campaigns are at generating new and repeat buyers. With drilldown, the user can examine this information at a highly summarized level and navigate to successively more detailed levels of campaign data; for example, viewing new vs. repeat buyers by Demand Channel, Partner, Marketing Program, Marketing Activity, Campaign ID, and Campaign Description. All activities are tracked and attributed to the last campaign to which visitors responded, even if this most recent campaign was seen prior to the current visit.
Shows the lifetime value of buyers for the most recent campaign they responded too, and displays it in a drilldown. A drill-down enables users to examine this information at a highly summarized level, and navigate to successively more detailed levels of campaign data; for example, viewing lifetime value of buyers by demand channels, partners, marketing programs, marketing activities, campaign IDs, campaign descriptions and more.
Shows campaign activity originating from various countries over a certain time period. With drilldown, the user can examine this information at a highly summarized level and navigate to successively more detailed levels of campaign data; for example, viewing revenue from various countries by Demand Channel, Partner, Marketing Program, Marketing Activity, Campaign ID, and Campaign Description. All activities are tracked and attributed to the last campaign to which visitors responded, even if this most recent campaign was seen prior to the current visit.
Shows campaign activity originating from various regions over a certain time period. With drilldown, the user can examine this information at a highly summarized level and navigate to successively more detailed levels of campaign data; for example, viewing revenue from various countries by Demand Channel, Partner, Marketing Program, Marketing Activity, Campaign ID, and Campaign Description. All activities are tracked and attributed to the last campaign to which visitors responded, even if this most recent campaign was seen prior to the current visit.
Shows campaign activity originating from various States/Provinces over a certain time period. With drilldown, the user can examine this information at a highly summarized level and navigate to successively more detailed levels of campaign data; for example, viewing revenue from various countries by Demand Channel, Partner, Marketing Program, Marketing Activity, Campaign ID, and Campaign Description. All activities are tracked and attributed to the last campaign to which visitors responded, even if this most recent campaign was seen prior to the current visit.
Shows campaign activity originating from various Metropolitan Statistical Areas (MSAs) over a certain time period. With drill-down the user can examine this information at a highly summarized level and navigate to successively more detailed levels of campaign data; for example, viewing revenue from various countries by Demand Channel, Partner, Marketing Program, Marketing Activity, Campaign ID, and Campaign Description. All activities are tracked and attributed to the last campaign to which visitors responded, even if this most recent campaign was seen prior to the current visit.
Shows campaign activity originating from different Designated Marketing Areas (DMAs) over the report time period. With drill-down the user can examine this information at a highly summarized level and navigate to successively more detailed levels of campaign data; for example, viewing revenue from various DMAs by Demand Channel, Partner, Marketing Program, Marketing Activity, Campaign ID, and Campaign Description. All activities are tracked and attributed to the last campaign to which visitors responded, even if this most recent campaign was seen prior to the current visit.
Shows the activity over time resulting from the most recent campaign that visitors responded to during the report time period. With drilldown, the user can examine this information at a highly summarized level and navigate to successively more detailed levels of campaign data; for example, identifying campaigns that had both a high number of daily and monthly visitors, and then examining that by Demand Channel, Partner, Marketing Program, Marketing Activity, Campaign ID, and Campaign Description.
email Campaigns
This report refers to the visitors' most recent email campaigns during the report time period. For the report time period, all conversions and other activities are tracked and attributed to the last email campaign to which visitors responded. Thus, even if the conversion does not happen on the first visit generated by the most recent campaign, the appropriate source is "credited" with the conversion. drill-down enables users to examine this information at a highly summarized level and navigate to successively more detailed levels of campaign data; for example, viewing visits, page views, revenue, and average order size by Partner, Marketing Program, Marketing Activity, Campaign ID, and Campaign Description.
This report shows each step in the Email Conversion Funnel and the number of visits that reached that step as a result of an email campaign.
Onsite Advertizing
Shows the number of times visitors viewed ads displayed on your site. Use this report to help measure the exposure of your on-site ads.
Shows the number of clicks generated by ads served on your site. It can help measure the relative effectiveness of your onsite ads in generating traffic to a specific destination.
Referrers
Identifies Web sites that refer visitors to your site. The top referrers are your site's primary acquisition channels, and may include a partner sites, search engines, portals or marketing program
Identifies domains that refer visitors to your Web site. The top referring domains are your site's primary acquisition channels and may include partner sites, search engines, portals or marketing programs.
Shows the pages from which visitors accessed your site. You can use this report together with the Top Referring Domains report to identify which pages on your top domains are sending the most traffic to your site.
Shows activity occurring in the current report time period organized according to visitors' first referrer on record
Search engines
Most Recent Search Engines (All)
Displays the most recent search engine and phrases that visitors used to access your site with measures evaluating those visits.
Most Recent Search Engines (Paid)
Displays the most recent paid search phrase and engine that a visitor used to access your site with measures evaluating those visits.
Most Recent Search Engines (Organic)
Displays the most recent organic search phrases and search engines that visitors used to access your site with measures evaluating those visits.
Most Recent Search Phrases (All)
Displays the most recent search phrase and engine that visitors used to access your site with measures evaluating those visits.
Most Recent Search Phrases (Paid)
Displays the most recent paid search phrase and engine that a visitor used to access your site with measures evaluating those visits.
Most Recent Search Phrases (Organic)
Displays the most recent organic search phrase and engine that visitors used to access your site with measures evaluating those visits.
Shows activity occurring in the current report time period organized according to the very first search engine and phrases visitors used to access your site. This report includes both paid and organic phrases.
Identifies search phrases that led the most visitors to your site, and for each phrase, which search engines led visitors to the site.
Identifies keywords that led the most visitors to the site and, for each keyword, which search engines led visitors to the site.
Visitors
Identifies the IP address, domain name, or cookie of each visitor, and identifies the visitor's activity level on the site. If you use cookies to track visits, Webtrends can differentiate between hits from different visitors with the same IP address
Helps evaluate the loyalty of repeat visitors as well as measure new visitor acquisition. To maintain the highest accuracy when counting new visitors, visitors who do not accept cookies are counted separately under Visitors Not Accepting Cookies.
This report shows visitor activity metrics by customer value segments, providing insight into the use of your site by different customer segments.
Geography
Provides a view of the geographic distribution of visitors. Hot spots may represent a central location of a service provider if more specific geographic information on the visitor is unavailable
Identifies the top countries of the visitors to your site. Use this report to understand how broadly your site is used
If the Webtrends GeoTrends Database is enabled for this profile, shows visits to your site segmented by the originating city of the visitor
Shows the activity that originated within a designated marketing area
Metropolitan Statistical Areas
Shows the activity that originated within a metropolitan statistical are
Primary Metropolitan Statistical Areas
Shows the activity that originated within a primary metropolitan statistical area.
Shows the activity that originated within a given area code
Commerce Reports
Commerce
Information about the buying cycle, buyer loyalty, and a quick view of purchase conversion trends.
Compares the activity of new and repeat buyers during the selected time period. Repeat buyers are visitors that have already made a purchase before the selected report period.
Merchandising
Evaluates visitor activity to products, and displays it in a drilldown. A drill-down enables users to examine this information at a highly summarized level, and navigate to successively more detailed levels of product data; for example, viewing visits, page views, revenue, and average order size by Product Group, Product Family, Product Category, Product Sub-category, Product Name, and Product SKU.
Provides information about activity, sales and revenue for products organized by product category. Product category analysis allows for high-level evaluation of profit centers in your merchandising mix.
Provides information about activity, sales and revenue for products organized by product sub-category. Product category analysis allows for high-level evaluation of profit centers in your merchandising mix.
Shows product activity organized by supplier.
Displays the product hierarchy drill-down categorized by manufacturer. You can compare product views, sales, revenue and average order size across manufacturers at any product drill-down level.
Displays performance details, sales and revenue for each product, broken down by SKU or (if you use a translation file) by product name. This report is especially useful if you plan to integrate external data with product reporting in an Excel file using Excel SmartReports or a Webtrends ODBC driver query.
Campaigns
Helps you compare how effectively each campaign channel drives product interest and purchase conversions. The relative success of each channel can help you allocate ad spending for future campaign efforts or prioritize search engine optimization.
Helps you determine your most valuable partner relationships by comparing levels of product interest and conversion rate. To compare merchandise interest, you can drill down on product category, group or SKU across each referring partner site.
Products by Marketing Programs
Helps you compare how effectively your marketing programs drive product interest and purchase conversions. The relative success of each marketing program can help you allocate ad spending for future campaign efforts.
Products by Marketing Activities
Helps you compare how effectively each marketing activity drives product interest and purchase conversions. The relative success of each marketing activity such as direct mail or keyword purchases can you allocate ad spending for future campaign efforts.
Helps you compare how effectively each ad creative type drives product interest and purchase conversions. The relative success of a creative type can show which ad types are most engaging and help you optimize creatives for future campaign efforts.
Helps you compare how effectively each ad creative drives product interest and purchase conversions. The relative success of a creative can show which ad creatives are most engaging and help you optimize creatives for future campaign efforts.
Helps you determine which offers are driving product interest and purchase conversions. Viewing product interest by special offer helps you quickly optimize offers to increase sales and average order size. This report also helps reveal product affinity when other products are purchased as a result of an offer on a particular product.
Helps you evaluate how effectively search engines promote sales of products. You can drill down into product categories to the level of individual product SKUs.
Segments
Products by New vs. Returning Visitors
Compares product interest and sales activity for returning visitors with the results for first-time visitor
Products by New vs. Repeat Buyers
Compares product interest and sales activity for frequent buyers with the results for first-time customers.
Shows product activity organized by country of origin.
Shows product activity organized by geographic region
Shows product activity organized by state or province.
Shows product activity organized by Metropolitan Statistical Areas as defined by the US Office of Management and Budget.
Shows product activity organized by Designated Marketing Area
Sales cycle
Shows the number of days between a new buyer’s initial visit and first purchase.
Sales Cycle by Product (New Buyers)
Shows the number of days between a new buyer’s initial visit and first purchase based on individual products.
Sales Cycle by Product Category (New Buyers)
Shows the number of days between a new buyer’s initial visit and first purchase based on product category, like DVD players.
Sales Cycle by Campaign (New Buyers)
Shows the number of days between a new buyer’s initial visit and first purchase based on campaign.
Shows the number of days between a new buyer’s initial visit and first purchase.
Shows the number of days between a new buyer’s initial visit and first purchase for each product.
Sales Cycle by Product Category
Shows the number of days between a new buyer’s initial visit and first purchase for each product.
Shows the number of days between a visitor's previous purchase and most recent purchase in this report period.
Content Reports
Provides a summary of the total number of Really Simple Syndication (RSS) subscriptions by feeds, the names of feeds visitors are subscribing to, and the percentage for each feed
Shows the breakdown of specific articles delivered for each type of Really Simple Syndication (RSS) feed and the number of times the RSS feed was requested.
Provides information about the geographical location of visitors when they subscribe to a specific RSS feed
Shows what type of media visitors are using when accessing the site. This report shows the types of media visitors have accessed, the total number of media (clip) events, the number of pages visited, and the amount of time the visitor spent at the site
Shows which clip content visitors are using when they access the media offerings on your site. This report illustrates the most popular media content consumed by visitors.
Shows which Rich Internet Applications (RIA) features are used most often by visitors. The information in this report can assist customers in understanding the usage and effectiveness of their RIA applications at the feature (micro) level to improve their RIA application designs
Shows which Rich Internet Applications (RIA) features are used most often by visitors. The information in this report can assist customers in understanding the usage and effectiveness of their RIA applications at the feature (micro) level to improve their RIA application designs
Shows the consumer-generated media (CGM) that visitors engage with when accessing the site
Purchase Conversion Funnel by Test Variant
Shows each test variant that visitors had been exposed to, and their completed steps in a purchase conversion funnel. The information in this report is useful in determining which test variant is most effective in moving a visitor through each step of the Purchase Conversion Funnel
Site Design Reports
Pages and Files
Identifies the most popular pages on your site and shows you key metrics for each page such as Visits, Page Views and Average Time Viewed.
Shows activity trends on your site based on the total page view volume for the report period. You can use this information to determine high and low points of visitor activity.
This report shows patterns of traffic to related groups of pages on your site. Content groups can show how visitors are accessing information categories that may not reflect the organization of your Web site. For example, you may want to look at visits by content area, or find out how many visitors use summaries or abstracts of site content
Identifies the most popular groups of Web site pages and how often they were visited
Provides insight into which areas of the site are most attractive to your visitors. Analyze the content groups for possible cross-promotions, or analyze over time to interpret content popularity.
Navigation
Focuses on pages that were most often the first or “entry” page of a visit. Each visit can have only one entry page. You can use this report to determine whether visitors are entering your Web site using the pages you expect.
Focuses on pages that were most often the final or "exit" page of a visit. You can use this report to determine whether visitors are exiting your Web site using the pages you expect, such as a specially designed Thank You page, or whether certain pages are causing visitors to abandon the visit prematurely.
Focuses on pages that were most often viewed during a visit consisting of exactly one page view. You can use this report to determine the success of certain pages designed to provide visitors with all needed information on a single page, or whether certain pages are causing visitors to abandon the visit prematurely
Browsers and Systems
Identifies the most popular browsers used by visitors to your site. You can use this information to improve your understanding of which technologies your visitors use so you can configure your Web site to optimize their visit experience.
Identifies robots, spiders, crawlers and search services that visit your site. This information can help you block spiders that use your server resources and understand the kind of automated attention you have attracted to your site.
Identifies the operating systems most used by the visitors to the site. This information will only be displayed if your server is logging the browser/platform information.
Client Details
Provides statistics about the top languages spoken by the visitors to your Web site. You can use this information to tailor your site content to visitor preferences
Provides statistics about the most common screen resolutions used by your visitors. You can use this information to improve your understanding of which technologies your visitors use so you can configure your Web site to optimize their visit experience
Provides statistics about the most common color palettes in use on your visitors' computers. You can use this information to improve your understanding of which technologies your visitors use so you can configure your Web site to optimize their visit experience
Provides statistics about the proportion of your site activity generated by visitors whose browsers have Java enabled. You can use this information to improve your understanding of which technologies your visitors use so you can configure your Web site to optimize their visit experience.
Provides statistics about the proportion of your site activity generated by visitors whose browsers have JavaScript enabled. You can use this information to improve your understanding of which technologies your visitors use so you can configure your Web site to optimize their visit experience
Shows the JavaScript versions in use by your visitors with JavaScript enabled. You can use this information to improve your understanding of which technologies your visitors use so you can configure your Web site to optimize their visit experience.
Tracks visitors' activity based on whether their browser accepts third party cookies or not.
Shows the GMT offset of the time zones where your Web site visitors are located.
Identifies the visitor’s connection type.
Wireless
Identifies the WAP (Wireless Application Protocol) devices most commonly used by visitors to your site. This information will only be displayed if your server is logging the browser/platform information.
Identifies the WAP (Wireless Application Protocol) browsers most commonly used by visitors to your site. This information will only be displayed if your server is logging the browser/platform information.
Site Performance Reports
Technical Statistics
Bandwidth: Kbytes Transferred Trend
Shows the bandwidth requirements of your site by tracking kilobytes transferred over the course of the report period
Activity
Shows the number of visits with activity in each hour of the day during the reporting period. Use this information to identify periods of high and low activity on your site, which may be useful in selecting system maintenance periods or in selecting campaign or promotion times.