Setting Up Site Overlay
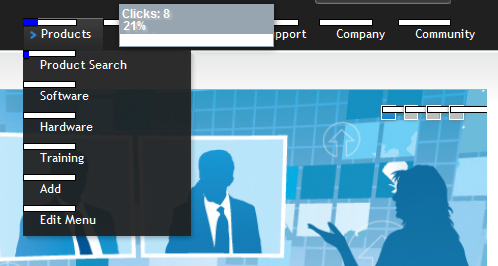
Site Overlay provides an easy-to-use visual map of popular links on a Web page, based on the frequency of clicks. When Site Overlay is enabled, each link on a page is represented by a horizontal bar graph. When you hover over the graph, you see its statistics. The following image shows menu links and the overlay bar graphs.

- Site Overlay requires Google Analytics as your Web Traffic provider. See Also: Google Web Analytics .
- Set the
web.configkeyek_AutoInsertBeaconScriptto true.<add key="ek_AutoInsertBeaconScript" value="true" />
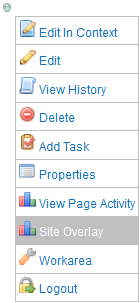
To enable Site Overlay, use the Content Menu by hovering over the access point (![]() ) and selecting Site Overlay.
) and selecting Site Overlay.
NOTE: You must be assigned the Analytics Viewer role or a member of the Administrators group.
- When Site Overlay is enabled, a toolbar appears at the top of the page and lets you change the date range of the Site Overlay data.

- Change the date range to view statistics for a different period. Default is one month before today. To refresh the page, click Refresh (
 ).
). - Click Remove Overlay to disable Site Overlay.
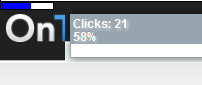
On every place that a visitor can click on your Web page, a bar graph indicates the percentage of clicks on this element. When you hover over a bar graph, you see a click count and a percentage comparing these clicks to all clicks on the page.
Troubleshooting Site Overlay
You may encounter these issues.
- Error message—"Username and/or password not set. Please update the AnalyticsDataProvider section on your
web.config. Parameter name: Username, Password." - The Google Analytics provider must be configured in
web.config. See Google Web Analytics - Clicks are not showing on the Overlay.
- Be sure enough time has elapsed since the clicks occurred and the Google Analytics provider has recognized them. (24 hours)
- Check that the key for
ek_AutoInsertBeaconScriptistrue.
Remarks about the data
- Data providers typically record clicks based on the
link hrefparameter. If a link with identical hrefs exists in more than one location on a page, the data provider reports each one clicked the same, equal to the total of all clicks for that href on that page. This means that if link A is clicked 10 times and link B is never clicked, but they have the same href parameters, both show 10 clicks. -
Some providers are case-sensitive in certain cases; Google data has been shown to report data separately when a letter-case of the page's URL changes. Therefore, clicks for “Test.aspx” might not show up for “test.aspx”.