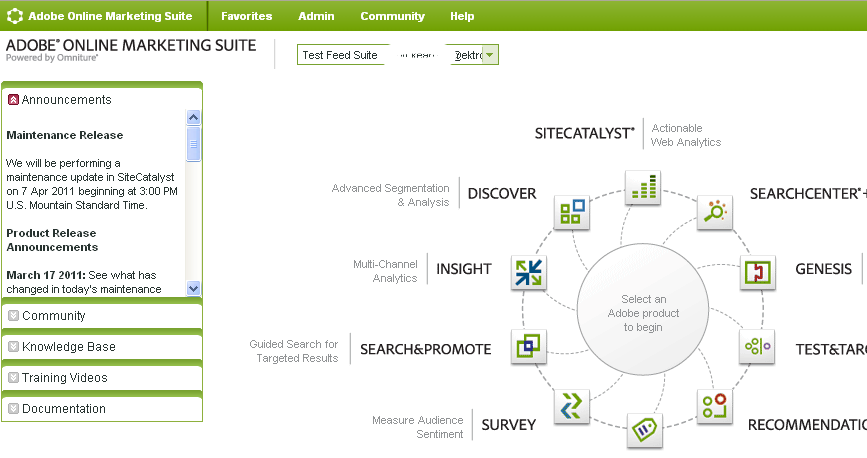
SiteCatalyst Analytics
Adobe's SiteCatalyst® (formerly known as Omniture) provides marketers with actionable, real-time intelligence about online strategies and marketing initiatives. SiteCatalysthelps marketers quickly identify the most profitable paths through their Web site, determine where visitors are navigating away from their site, and identify critical success metrics for online marketing campaigns. (source: http://www.omniture.com/en/products/online_analytics/sitecatalyst)
- Log onto site and generate tracking code.
- Contact Adobe and set up an account to use SiteCatalyst.
- Use the information Adobe provides (URL, username, password, and so on) to log in to Adobe Online Marketing Suite.


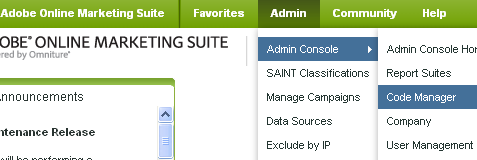
- Click Admin > Admin Console > Code Manager.
- In the Select the type of code to generate drop-down, choose Javascript.
- In the Select a Report Suite that collects data for your website drop-down, choose a report suite you selected when setting up your SiteCatalyst account.
- In the Match the Character-Encoding of your website drop-down, choose UTF-8.
- In the Choose your Currency for Tracking Conversion drop-down, choose your currency.
- In the How many periods are in your domain name? drop-down, enter the appropriate number. The screen shows an example.
- If your site uses SSL, check the box next to Use https:// instead of http://?. See Also: Configuring SSL
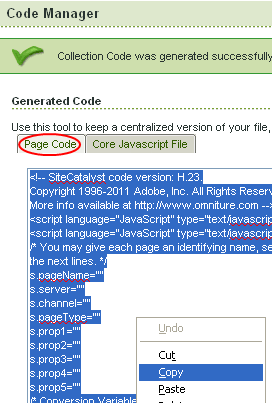
- Click Generate Code.
- Copy the tracking code to
sitecatalyst.ascx.- The Code Manager screen displays code to track analytics on your Ektron site. Copy the code under the Page Code tab.
- Open the following file:
site root\Workarea\Analytics\template\sitecatalyst.ascx. - Delete all text below the following line.
<%@ Control Language="C#" AutoEventWireup="true" CodeFile="sitecatalyst.ascx.cs"
Inherits="Analytics_Template_SiteCatalyst" EnableTheming="false"
EnableViewState="false" %>false" %>
- Paste the code you copied in Step 1 into
sitecatalyst.ascx, below the line shown above. - Save
sitecatalyst.ascx.
- The Code Manager screen displays code to track analytics on your Ektron site. Copy the code under the Page Code tab.
- Copy the
s_code.jsfile to Workarea folder.- Use the Code Manager screen'sCode Archive Name field to assign a name to the files you created in the previous step.
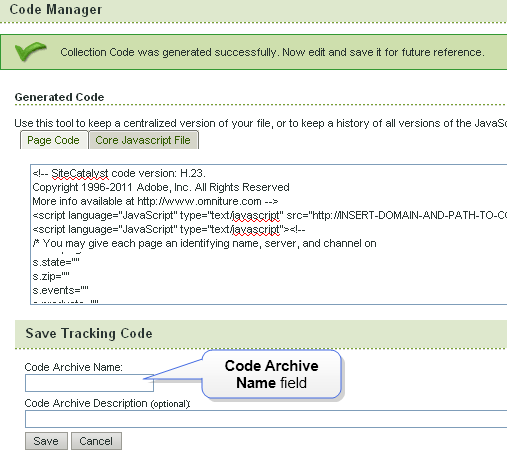
- Use the Code Archive Description field to assign a more detailed description to the files you created in SiteCatalyst Analytics.
- Click Save. Code Manager compresses the Page Code and Core Javsascript files into a .zip file, and displays them under Saved Code.
- Click Download next to the saved .zip file. You are prompted to download the .zip file to your computer.
- Click OK.
- Open the downloaded .zip file.
- Extract the
s_code.jsfile tosite root\workarea\analytics\template. You may be prompted to confirm that you are overwriting a file of that name already in the folder.
- Use the Code Manager screen'sCode Archive Name field to assign a name to the files you created in the previous step.
- Update Ektron's
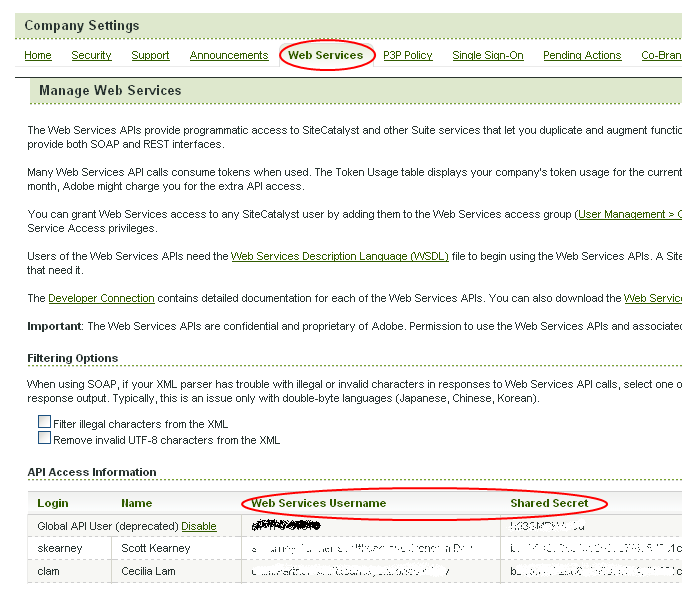
web.configfile.NOTE: Your SiteCatalystWeb Services Username and Shared Secret. To obtain, log in to Adobe Online Marketing Suite and click Admin > Admin Console > Company > Company Home > Web Services.
- Open your
siteroot/web.configfile. - Find the tag beginning with
<add name="SiteCatalyst". - Replace the SiteCatalyst tag's properties.
- Name—Do not change.
- Type—Do not change.
- Username, Secret—
- Go to
C:\Program Files\Ektron\CMS400v8x\Utilities.
\EncryptEmailPassword.exe - Encrypt the SiteCatalyst Web Services Username and Shared Secret you obtained.
- Enter the encrypted values into these properties.
- Go to
- CompanyName—Enter the company name obtained from Adobe when your account was created.
- ReportSuiteID—Enter the ReportSuiteID obtained from Adobe when your account was created.
- SiteURL—Enter the site URL. For example,
www.example.com. - Endpoint—Enter your account's endpoint. You obtain one when you set up your SiteCatalyst account. An endpoint looks like this:
https://api-sbx1.omniture.com/admin/1.2/rest/. - CacheInterval—You can use this field to cache the Analytics provider's data. Enter a number in seconds. The maximum 86400 (24 hours). Caching improves the performance of the traffic report page.
- AnalyticsTrackingCodePath—Do not change.
- Open your
SiteCatalyst Reports
You can access site-level SiteCatalyst reports from within the Ektron Workarea by selecting Reports > Traffic Analytics > SiteCatalyst.
NOTE: The descriptions were adapted from SiteCatalyst Analytics Help Center (https://sitecatalyst-sbx1.omniture.com/sc14/reports/index.html). Check that site for additional details on the reports.
Site Metrics
Displays the number of times your Web site pages were viewed for the selected time period (hour, day, week, month, quarter or year). This report lets you track page views for each individual page on your site, as well as an aggregate of page views for your Web site as a whole.
Displays the number of visits made to your Web site during the selected time period.
Shows the number of unique visitors to your site for a selected daily time frame. A unique visitor is counted the first time he/she visits your site within the selected time frame. If a visitor returns again to your site, they are not counted as a unique user again until the selected time frame has passed.
Reveals the length of time visitors spend viewing your site as a whole during each visit. It also has an Average Time Spent on Site statistic that shows the average time that was spent viewing your site, taken across all visitors.
Site Content
Ranks pages on your site based on those that receive the most traffic.
Shows the areas of your site that were visited most by your site customers. Site Sections could include (but are not limited to) groups of products, similar to Categories. Data for the Conversion Site Sections report is imported from the Site Section report in the Traffic group, which receives its information from the channel variable in the SiteCatalyst tracking code. You can use this report to identify the greatest impact on site statistics from items in varying site sections.
SiteCatalyst lets you group pages together that are being hosted by a particular server. For example, if you have a Web site that is hosted on two different servers, you may want to see if one server is serving more impressions than the other server. This report lists all of the servers of your Web site that are being tracked by SiteCatalyst and tells you which servers are being accessed the most.
Shows links that your visitors click to leave your site and go to another site. Exit links are those links that take your visitor to another site. Most common examples of exit links are links to partners, affiliates, and so on.
Shows links your site visitors prefer, helping you better understand the navigation patterns within your site.
Displays files that have been downloaded from your Web site. These files can be any type of document you wish to track, including user manuals, presentations, audio, or video files. This report requires that link tracking code to be installed on the site you are tracking.
Lists the number of times a Page Not Found (404- error) page appears to your site visitors and lists the URLs of the pages that were not found.
Paths
Shows the number of times individual pages were reloaded by page visitors.
Identifies the depth at which each page within your site is visited. Depth for a page is measured by counting the number of pages viewed before that page. So, if your "About Us" page is the third page visited by a given visitor, its depth for that visit is 3. You can use this report to identify which pages compel your visitors to travel the deepest into your site and to optimize content and navigation to make key content more accessible.
Displays the length of time that visitors browse individual pages in your site. The time spent is divided into 10 categories: less than 15 seconds, 15-30 seconds, 30-60 seconds, 1-3 minutes, 3-5 minutes, 5-10 minutes, 10-15 minutes, 15-20 minutes, 20-30 minutes and greater than 30 minutes.
Shows, by percentage and total visits, which pages on your site are the first ones seen by new visitors.
Shows the first page viewed of the first-ever visit to your site. Each user is counted only once unless they delete their cookies or are not being tracked with cookie
Traffic Sources
Displays a breakdown of each search keyword that has been used to find your site. You can sort this list by page views or search keywords by clicking the column title above the listing. Click on the blue magnifying glass next to each search keyword to see the actual search results screens where your site was listed.
Search engines—All, Paid, Natural
Helps you learn which search engines people are using to find your Web page. The graph shows you the percentage breakdown of the search engines that have been used to find your site.
Shows the results pages on which your site links were located in the user's searches that were performed. For example, a user who came to your site from a search engine may have seen you on the third of one hundred pages of results. This can help you quickly see and optimize search engine efforts. Data for this report may be viewed for all but the 'Hourly' time period.
Shows the domains that referred the customers that most impacted your site's Success Metrics. Referrers fall into 2 main categories: Domains and URLs. Domains refer to the domain name, and appear as the base domain without the query string or subdirectories attached. URLs include the base domain name, as well as any query strings or subdirectories.
Shows the original referrers that produced the customers on your site. Customers can visit your site multiple times, and have a different referrer for each visit. This report shows how they were referred the first time they arrived at your site. This can help you see if they continued to use the same referrer and view patterns in how customers are referred to your site. You can view the number of visitors generated by an original referrer or discover how much revenue each original referrer was responsible for producing.
Visitor Retention
Shows the number of visitors who returned to your site within one of the following categories (representing the time lapse between visits): less than 1 day, 1-3 days, 3-7 days, 8-14 days, 14 days to 1 month and longer than 1 month.
Provides another method for gauging visitor loyalty by displaying the visit number for each visitor that comes to your site.
Visitor Profile
Geosegmentation
- Countries—Shows countries from which visitors access your site. In addition to the standard "Ranked" and "Trended" views available on most reports, there is also a "Map" view that color-codes the countries according to their relative contribution to your total traffic-the more intense the color the greater the number of daily unique visitors from that country that are visiting your site
- Regions—Shows regions from which visitors access your site. To the right of each region shown, the country of the region is also shown in parentheses. Clicking the magnifying glass icon to the left of the region will open the line item in the SiteCatalyst Cities Report. With this report, you can see how a selected region performed compared to another on your web site.
- State—The U.S. states from which visitors access your site.
- Zip/postal code—Shows the zip and postal codes that produced the customers that had the greatest effect on purchase success metrics.
- Cities—Shows U.S. cities from which visitors access your site.
- U.S. DMA (Designated Market Area)—Shows the marketing areas within the United States from which visitors access your site. By clicking the link next to State in the Report Status header, you may restrict the report to marketing areas within a particular state. This data is provided via a partnership between Omniture and Nielsen Media Research, Inc. By clicking the Visitors Per Capita link next to Display in the Report Status header, you can adjust the data by the relative population of each marketing area. Enabling this option shows both the number of daily unique site visitors per 10,000 people living in the market area as well as the percent above or below the national average value. You can also generate a Correlation report by clicking the Correlation icon next to one of the market areas and selecting the item with which you want to correlate the data.
- Visitor Home Page—Another method of gauging visitor loyalty and assessing the perceived value your visitors place on your Web site's content. The report shows how often your visitors mark a page on your Web site as their 'Home Page' in their browser.
- Language—Displays your visitors' preferred languages. The Languages Report captures the default browser language and displays those most used by visitors to your site.
- Time zone—Displays the time zones your visitors are located in when they view your site. This report superimposes a bar graph (indicating the number of visitors) on a map of the world so you can quickly see what part of the world your visitors are from.
- Domains—Lists the organizations and ISPs your visitors use to browse your site. This report differs from the Full Domains report in that the Full Domains report registers the full ISP domain, whereas this report lists the secondary domain.
- Top Level Domains—Identifies world regions that visitors come from, based on their originating domain extension, and shows how many visitors come from these countries. Domains ending in Commercial (.com), Network (.net), Education (.edu), Government (.gov) and Organization (.org) are usually based in the United States, and are listed separately from the rest of the domains.
Technology
- Browsers—Identifies the types and versions of browsers that are used by your visitors.
- Browser Type—Classifies the browsers visiting your site into their major families
- Browser Width, Browser Height—Shows the most common widths or heights of the browsers (in pixels) your visitors use to view your site.
- Operating Systems—Shows which operating systems are being used by your site visitors
- Monitor Color Depth—Shows your visitors' most popular color-depth settings as configured on their computer. Color-depth refers to the number of colors that can be displayed on the screen.
- Monitor Resolutions—Shows screen resolutions that visitors to your Web site most commonly use, as configured on their computers.
- Java, JavaScript —The JavaScript Version report displays the versions of JavaScript your visitors' browsers use while viewing your site.
- Cookies—Shows the percentage of visitors that prefer to use cookies while browsing.
- Connection Type—Displays the percentage of your site's visitors that utilize high-speed Internet connections versus slower dial-up connections.