Diagnostics Utility
Ektron's Diagnostics Utility provides comprehensive information about servers in your Ektron network that are related to the Web site to which you are logged on. (An Ektron network consists of your Ektron server, connected database servers, and other servers with which your Web site has an eSync or Load Balance relationship.)
The utility gives you and Ektron's Support staff a real-time snapshot of all servers in the network, and includes the following for each node.
- status of all services
- version information for Windows, SQL, IIS, Visual Studio, and so on.
- event log
- database connection status, test query, server, and so on.
- for each server: drive capacity and available space; available memory, and so on.
- eSync information, such as remote certificates for this server
NOTE: Most Diagnostics fields are read-only. The utility lets you perform only a few actions.
The following webinars provides a lot of good information about the Diagnostic Utility: http://www.ektron.com/resources/webinars/85-enterprise-dashboard/, The Making of Ektron eSync Diagnostics
This section explains what you need to know about the Diagnostics Utility: how to install it, the information it provides, and how to "capture" its current state. You can save the captured files for comparison with previous and future versions, and send them to Ektron's Support staff for diagnosis.
How the Diagnostics Utility Works
- The Diagnostics Utility uses a Workarea Web service that is installed to the Ektron server. This service runs independently of the Ektron Windows Service and your Ektron Web site.
- That Web service routes requests to the Ektron Diagnostics Service.
- The Ektron Diagnostics Service collects diagnostic information from the database, Web site files, and other locations like the event log. It also scans for other known Web servers (eSync servers, load balance servers, and multi-site servers).
- If any other servers are found, the Diagnostics Windows Service opens a connection to the destination server's Diagnostics service. The Diagnostics Service uses the same port as the Ektron Windows service.
- The Ektron Diagnostics Service returns the collected data to the Silverlight viewer, which dynamically builds the network that appears on the screen.
Installing the Diagnostics Utility
An opportunity to install the Diagnostics Utility appears during the installation or upgrade of Ektron (see top checkbox in dialog below).
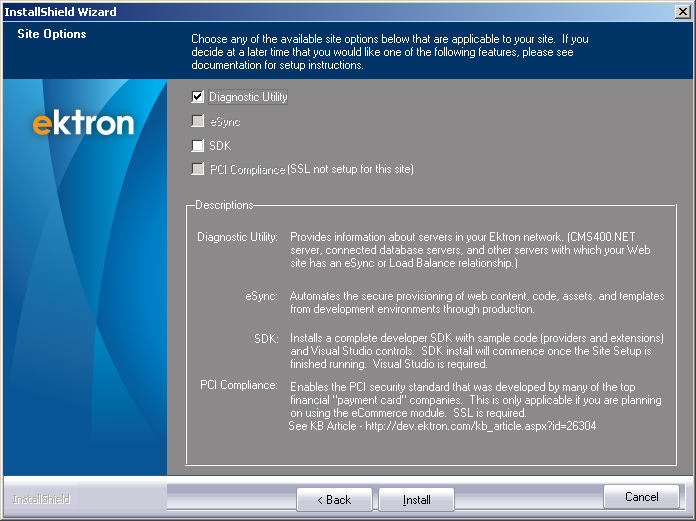
If Diagnostic Utility is not checked during installation, you can install it by going to Windows Start button > All Programs > Ektron > CMS400v8x > Utilities > Ektron Diagnostic Utility.
Install the utility to every Web site and server in your Ektron network. This includes Ektron Web servers, as well as servers used in Load Balance and eSync configurations.
You do not need to install the utility on client workstations.
The Diagnostics Utility installs the following files on each server.
web.configfile additions- the Ektron Diagnostics Windows service
NOTE: If the Diagnostics Utility is not installed on a server, a node for that server appears, but information about it is not available in the lower section of the screen, and additional relationships are not visible.
For example, you have an eSync relationship between development and staging servers, and between staging and production servers. If the Diagnostics Utility is installed on the development server but not on staging, and you view the network from the development Workarea, you see nodes for development and staging, but not production. You can view details for development, but not staging.
Accessing the Diagnostics Utility
Prerequisites:
- You are a member of the Ektron Administrator's group
- The Diagnostics Utility was installed on every server with which your Web site has an eSync or Load Balance relationship
- The Diagnostics Utility requires Silverlight 4. If a client does not have it, you are prompted to install it before you can view the screen.
Access the Diagnostics Utility from the Ektron Workarea, by going to Settings > Configuration > Diagnostics.
Information Provided by the Diagnostics Utility
The Diagnostics screen consists of nodes in your Ektron network connected by lines that indicate relationships. Use the slider on the right side to adjust the zoom level.

You may drag the nodes around for easier viewing.
This section also contains the following topics, which explain the information on the Diagnostics screen.
Connecting Lines on the Diagnostics Screen
A connecting line's color indicates the type of relationship that exists between nodes.
|
Connecting line color |
Relationship | More information |
|---|---|---|
| Blue | eSync |
The arrowhead direction indicates the direction of the profiles.
|
| Red | Database server | Appears even if the database resides on the same server with Ektron. |
| Green | Load balance | |
| Teal | Multi-site |
Network Node Icons
This section describes icons that may appear within a network node.
![]()
-
 Analysis— Reports server's installed memory, available memory, and available disk space. Click the icon for more information. See Also: Analysis
 -
 Bandwidth test—Reports speed of server's connections. Click the icon for more information. Bandwidth Test
 -
 Refresh—For selected node, load or reload Details in the Lower Section of the Diagnostics Utility. Click the icon for more information.
 -
 Warning—When hovered over, displays a warning about the node. For example, if your database resides on an Ektron server, you are advised to move the database to its own server.
 -
 Web server—Hosts Ektron.
 -
 Database—Hosts MS SQL Server.
Bandwidth Test
You can run a bandwidth test between any 2 network nodes. The test checks the speed of the selected server's connections. To accomplish this, the test sends a 32 MB file in both directions then reports the transfer time.
Before

After

As an example of when you would conduct a bandwidth test, assume it takes a long time to sync a production server with a staging server. Use a bandwidth test to diagnose the problem.

Details in the Lower Section of the Diagnostics Utility
The lower section of the Diagnostics Utility screen provides a wealth of information about your Ektron network.

The tabs across the top indicate main areas of interest.
Basic Diagnostics
IMPORTANT: The Diagnostics screen runs as a Windows Service. So, that service must have administrator access to perform the tests and retrieve the necessary information.
The basic diagnostics screen has several subtabs:
- Basic Connectivity—Displays server name, site URL, connection string, paths to site, workarea, assets, private assets, uploaded files and images, asset library


- Version—Installed version of Ektron, Windows service, IIS, Visual Studio

- License—License key, status, expiration date, enabled features, maximum users

- Settings—Active Directory, SMTP port, and DMS settings

- Database—Connection status, Test query, SQL version, Database server, Database name, Integrated Security (true/false).

- Connections—Status of the following services:
- server controls Web service
- content Web service
- content service
- indexing service
- Windows services 2.0, 3.0, and 4.0

- Security—Information for the 10 default accounts installed with an Ektron sample site.
- if user exists
- if default password was changed
See Also: Securing Ektron

- Permissions—User permission settings for these DMS folders:
- asset library\servername\site name
- \siteroot\assetmanagement\dmdata
- \siteroot\assets
See Also: Checking Document Management Permissions

- Events—The Windows Event Log
- each event includes: event, event type, time of occurrence, description, source
- sorted by log name

- Authentication—Active Directory and LDAP settings
See Also: Active Directory, Using LDAP with Ektron

Server Details
The Server Details tab provides information about the selected server.

The tab displays the following information.
- Server index
- Share index
- Server time (UTC)
- OS architecture (32 or 64 bit)
- Number of Processors
- CLR Version
- OS version
- Memory: total, available, current process usage
- System storage: for each drive, the capacity and available space in megabytes
- Site databases: name, Maximum size, location, size and type
- Your Web site's asset server: callback URL, ID, date modified, and so on.
Sync Certificates
Use this tab to view the site's encoded eSync certificate, copied from the web.config file.

The tab also displays all remote certificates for this server. Checks in the lower section indicate the presence of certificate files on all servers. See Also: ManagingeSync Security Certificates
NOTE: The tab does not indicate if the certificates on the servers in the sync relationship match.
Sync Scope
The Sync Scope tab retrieves details from the serverinfo.xml file. The tab also shows information about saved eSync profiles. See Also: Setting up eSync Profiles

Here is an example of what appears when you click View Child Profiles.

The bottom section of the Sync Scope tab shows information for the eSync Logs. See Also: Sync Logs

Site Details
The Site Details tab shows Files over 100 MB in the site and the Knowledge and Metadata Files Screen.

Legend for the Knowledge and Metadata Files Screen
- Gray circle—no files to view
- Green circle—you can view files under that server and its folders
Service Status
The Service Status tab provides information about Ektron Windows Service (EWS). It also lets you stop and start the service. See Also: Ektron Windows Service

This screen tells you
- how much memory the service is using
- the user account under which it runs
- its status
- the name, address, and status of each internal Web service that EWS is running

Exporting and Viewing Saved Diagnostic Information
You can easily "capture" the current Diagnostic information. The captured files can be saved for comparison with previous and future versions, and sent to Ektron's Support staff for diagnosis.
The export file collects all information described in Details in the Lower Section of the Diagnostics Utility from each server. The file also includes a copy all configuration files and logs for all servers in your Web site's network. This information is packed into a .zip file for easy storage and transfer.
To capture Diagnostics information, click Export Map.

Contents of the .Zip File
Inside the .zip file are
- other zipped files, which contain the captured config files and log files.
- a
NetworkMap.ekdfile. This file may be loaded in the Diagnostic utiilty, in the Silverlight viewer, or in a text editor, such as Notepad (the saved data is XML.) See Also: View an Exported Map

The values of all files are those that existed when you clicked the Export Map button.
View an Exported Map
Prerequisite: The location of the exported map file on your computer. The file's name is DiagExportdate-time.zip.
- From the Ektron Workarea, go to Settings > Configuration > Diagnostics > Load Save button.
- Navigate to the saved DiagExportdate-time.zip file.
- Click Open.
- Click any node to view its information.
NOTE: You can also use the
C:\Program Files\Ektron\EktronDiagnosticsService\Tools\EktronDiagnosticsWPF.exe to view a networkmap.ekd file.
![]()